

Unemployment Rate Facts
POSTED BY: JEWELSTAITEFAN
UPDATED: Monday, September 14, 2026 20:17
VIEWED: 54373
PAGE 1 of 10

OP mistakenly deleted.
NOTIFY: Y | REPLY | REPLY WITH QUOTE | PERMALINK | TOP | HOME

I'd tell you that I don't have time to look into it right now, but I'd be lying. I've actually got a lot of free time now. Not as much as when I was completely unemployed, but more than enough. 
I've been working on my side project, but I think I'm going to turn in early and actually flip back to a day schedule on my off days this time. I'm hoping for an opportunity to see my niece since I haven't seen her since Christmas.
If you'd like to look into it a bit yourself, I suggest looking at Underemployment as a starter. It's probably the biggest factor in why the current unemployment rate statistics are a lie.
Quote:
Underemployment (or disguised unemployment) is the under-use of a worker due to a job that does not use the worker's skills, or is part time, or leaves the worker idle. Examples include holding a part-time job despite desiring full-time work, and overqualification, where the employee has education, experience, or skills beyond the requirements of the job
https://en.wikipedia.org/wiki/Underemployment
A lot of this has to do with jobs being shipped overseas, but as has been discussed in here before it's also a matter of automation, or computers otherwise being able to do a lot of work that had to be done by humans before. I know I've bitched about my salary going to pay 5 to 10 Indians with much more education than me before, but the truth is that almost 10 years after I was laid off I'll bet 50% of my old job doesn't even need to be done by a human being anymore.
Probably the second largest reason the unemployment numbers are a lie is because they only count people who are actively handing in reports every week about their unemployment status to draw an unemployment check. You're perfectly free to continue to hand in these reports after you've exhausted your benefits and remain on that statistic, but I don't see why anybody would do that once the free checks stop coming in.
My last unemployment stint was just under 2 1/2 years long. Only 6 months of that time I was considered unemployed. Now that I have a part-time job that number didn't change at all, simply because I already was considered not part of unemployment for that reason. However, had I gotten that part time job immediately after being laid off from my great full time job I would not be considered unemployed (and they don't ever factor underemployment in the statistics that are presented to the public).
This second part is something that Trump used to talk about when he said the unemployment numbers were bullshit before he was president. Funny how he doesn't talk about that anymore though, innit?
Do Right, Be Right. :)
NOTIFY: Y | REPLY | REPLY WITH QUOTE | PERMALINK | TOP | HOME
The Fake figures Obama boasted in 2016 were fake. But now Trump has returned real numbers back to the reports, in line with 2008.
Review the figures and identify what you feel are fake numbers for Trump.
NOTIFY: Y | REPLY | REPLY WITH QUOTE | PERMALINK | TOP | HOME
Your graph is not readable. You need to either link the spreadsheet or readable table you got the information from, or put it in a Google spreadsheet so everyone can read it.
You ignored the two things I told you to look at, so I'm going to ignore your request... at least until you present a readable graph.
Do Right, Be Right. :)
NOTIFY: Y | REPLY | REPLY WITH QUOTE | PERMALINK | TOP | HOME

Quote:This is the same source Trump is using. There is no change between Obama leaving and Trump's first year. For many years, % unemployment has been dropping in a wiggly line and the number of people employed has been rising in a nice smooth line.
Originally posted by JEWELSTAITEFAN:
The Fake figures Obama boasted in 2016 were fake. But now Trump has returned real numbers back to the reports, in line with 2008.
Review the figures and identify what you feel are fake numbers for Trump.
If you want the XLS file, it is here: https://goo.gl/cUv5zQ
Blue Line is Civilian Unemployment Rate. Jun 2009=100
Red Line is All Employees: Total Nonfarm Payrolls, Jun 2009=100
June 2009 is the end of the last recession.
https://fred.stlouisfed.org/graph/?g=iU78
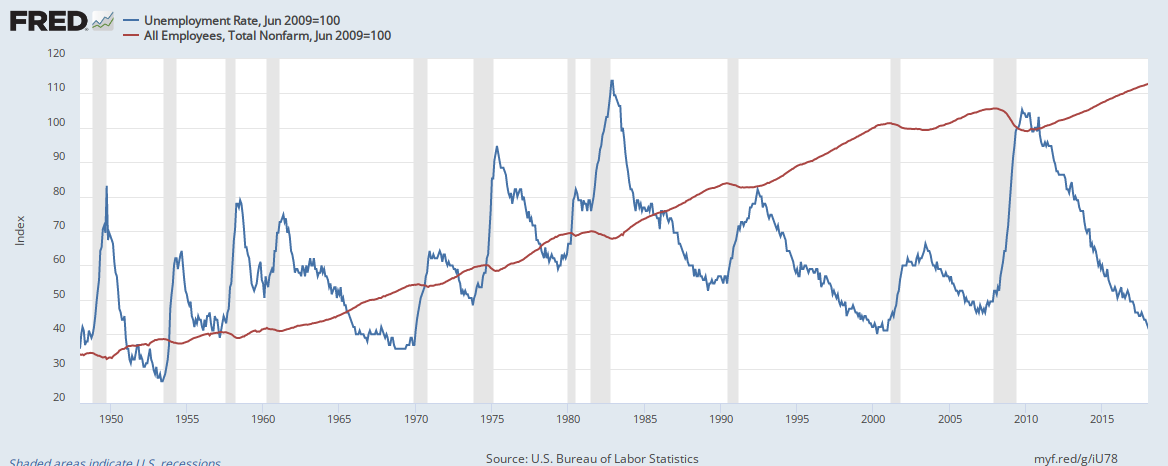
Graphing it with the Y-axis on the right side as % unemployment (rather than 0-100) looks much the same:
https://fred.stlouisfed.org/graph/?g=iU7R
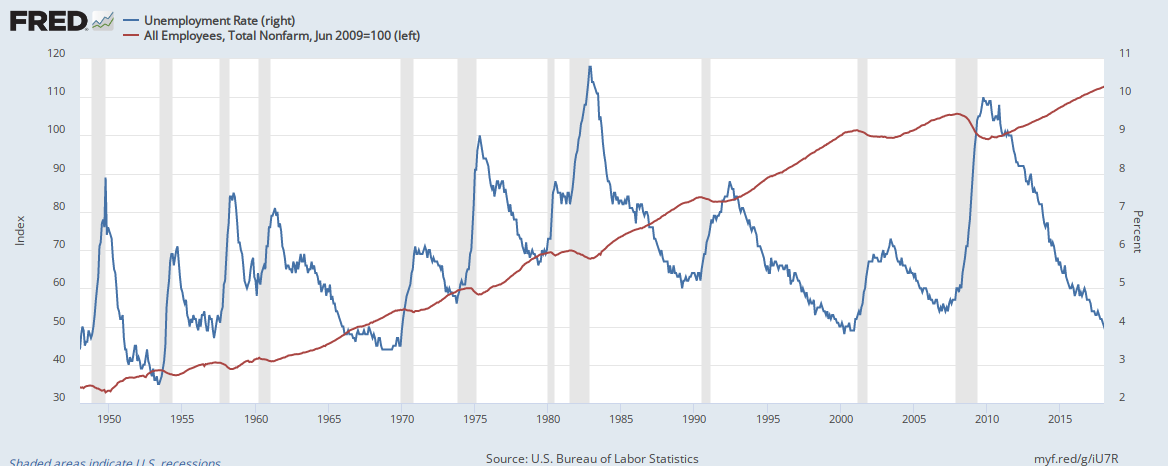
Graphing with the Y-axis on the left as thousands of employed (rather than 0-100) also looks much the same:
https://fred.stlouisfed.org/graph/?g=iU8w

The Joss Whedon script for Serenity, where Wash lives, is Serenity-190pages.pdf at www.mediafire.com/folder/1uwh75oa407q8/Firefly
NOTIFY: Y | REPLY | REPLY WITH QUOTE | PERMALINK | TOP | HOME
None of those graphs consider underemployment or people who are still unemployed but have stopped making weekly claims once their benefits ran out.
You won't find any official graphs that show any of this information and paint a real picture of the whole situation.
Therefore, anyone making these stats, citing these stats or touting these stats is lying either wittingly or unwittingly.
Do Right, Be Right. :)
NOTIFY: Y | REPLY | REPLY WITH QUOTE | PERMALINK | TOP | HOME
Quote:I did include your second item.
Originally posted by 6IXSTRINGJACK:
None of those graphs consider underemployment or people who are still unemployed but have stopped making weekly claims once their benefits ran out.
You won't find any official graphs that show any of this information and paint a real picture of the whole situation.
Therefore, anyone making these stats, citing these stats or touting these stats is lying either wittingly or unwittingly.
Do Right, Be Right. :)
Are you saying the rows word wrap?
NOTIFY: Y | REPLY | REPLY WITH QUOTE | PERMALINK | TOP | HOME
Quote:The Bureau of Labor Statistics says you are mistaken.
Originally posted by 6IXSTRINGJACK:
None of those graphs consider underemployment or people who are still unemployed but have stopped making weekly claims once their benefits ran out.
You won't find any official graphs that show any of this information and paint a real picture of the whole situation.
Therefore, anyone making these stats, citing these stats or touting these stats is lying either wittingly or unwittingly.
They do count you, even if your unemployment insurance benefits have stopped because you have been out-of-work too many weeks. There is a long and complicated explanation of how the number of long term unemployed are counted. No, they don’t call 333,000,000 Americans www.census.gov/popclock/ to ask them if they are working. Instead, they ask only 1,000,000 people, each and every month. And then they use statistics to figure out what the other 332,000,000 Americans are working. www.bls.gov/cps/cps_htgm.pdf
What do the unemployment Insurance (Ul) figures measure?
While the UI claims data provide useful information, they are not used to measure total unemployment because they exclude several important groups. To begin with, not all workers are covered by UI programs. For example, self-employed workers, unpaid family workers, workers in certain not-for-profit organizations, and several other small (primarily seasonal) worker categories are not covered. . . .
Because of these and other limitations, statistics on insured unemployment cannot be used as a measure of total unemployment in the United States. Indeed, over the past decade, only about one-third of the total unemployed, on average, received regular UI benefits.
The Joss Whedon script for Serenity, where Wash lives, is Serenity-190pages.pdf at www.mediafire.com/folder/1uwh75oa407q8/Firefly
NOTIFY: Y | REPLY | REPLY WITH QUOTE | PERMALINK | TOP | HOME
Quote:Are the Long-term Unemployed counted among the Marginally Attached to the Labor Force, or counted among the Labor Force, or not counted among either?
Originally posted by second:Quote:The Bureau of Labor Statistics says you are mistaken.
Originally posted by 6IXSTRINGJACK:
None of those graphs consider underemployment or people who are still unemployed but have stopped making weekly claims once their benefits ran out.
You won't find any official graphs that show any of this information and paint a real picture of the whole situation.
Therefore, anyone making these stats, citing these stats or touting these stats is lying either wittingly or unwittingly.
They do count you, even if your unemployment insurance benefits have stopped because you have been out-of-work too many weeks. There is a long and complicated explanation of how the number of long term unemployed are counted. No, they don’t call 333,000,000 Americans www.census.gov/popclock/ to ask them if they are working. Instead, they ask only 1,000,000 people, each and every month. And then they use statistics to figure out what the other 332,000,000 Americans are working. www.bls.gov/cps/cps_htgm.pdf
What do the unemployment Insurance (Ul) figures measure?
While the UI claims data provide useful information, they are not used to measure total unemployment because they exclude several important groups. To begin with, not all workers are covered by UI programs. For example, self-employed workers, unpaid family workers, workers in certain not-for-profit organizations, and several other small (primarily seasonal) worker categories are not covered. . . .
Because of these and other limitations, statistics on insured unemployment cannot be used as a measure of total unemployment in the United States. Indeed, over the past decade, only about one-third of the total unemployed, on average, received regular UI benefits.
NOTIFY: Y | REPLY | REPLY WITH QUOTE | PERMALINK | TOP | HOME
Quote:When the Bureau of Labor Statistics asks, tell them the truth: Do you got a job? Or are you in jail, in the army, in a mental institution (those last 3 don't count as being employed), whatever. "Each month, highly trained and experienced Census Bureau employees contact the 60,000 eligible sample households and ask about the labor force activities (jobholding and job seeking) or non-labor force status of the members of these households. These are live interviews conducted either in person or over the phone." - www.bls.gov/cps/cps_htgm.pdf
Originally posted by JEWELSTAITEFAN:
Are the Long-term Unemployed counted among the Marginally Attached to the Labor Force, or counted among the Labor Force, or not counted among either?
That's how unemployment is calculated -- the Bureau of Labor Statistics asks Americans questions. The process cannot produce an incorrect unemployment rate if Americans tell the truth about working or not.
This is an interesting figure:
www.bls.gov/charts/employment-situation/persons-not-in-the-labor-force
-who-want-a-job.htm
Again, the figure cannot be wrong if Americans tell the truth about wanting a job.
The Joss Whedon script for Serenity, where Wash lives, is Serenity-190pages.pdf at www.mediafire.com/folder/1uwh75oa407q8/Firefly
NOTIFY: Y | REPLY | REPLY WITH QUOTE | PERMALINK | TOP | HOME
Quote:
Originally posted by second:Quote:The Bureau of Labor Statistics says you are mistaken.
Originally posted by 6IXSTRINGJACK:
None of those graphs consider underemployment or people who are still unemployed but have stopped making weekly claims once their benefits ran out.
You won't find any official graphs that show any of this information and paint a real picture of the whole situation.
Therefore, anyone making these stats, citing these stats or touting these stats is lying either wittingly or unwittingly.
They do count you, even if your unemployment insurance benefits have stopped because you have been out-of-work too many weeks. There is a long and complicated explanation of how the number of long term unemployed are counted. No, they don’t call 333,000,000 Americans www.census.gov/popclock/ to ask them if they are working. Instead, they ask only 1,000,000 people, each and every month. And then they use statistics to figure out what the other 332,000,000 Americans are working. www.bls.gov/cps/cps_htgm.pdf
What do the unemployment Insurance (Ul) figures measure?
While the UI claims data provide useful information, they are not used to measure total unemployment because they exclude several important groups. To begin with, not all workers are covered by UI programs. For example, self-employed workers, unpaid family workers, workers in certain not-for-profit organizations, and several other small (primarily seasonal) worker categories are not covered. . . .
Because of these and other limitations, statistics on insured unemployment cannot be used as a measure of total unemployment in the United States. Indeed, over the past decade, only about one-third of the total unemployed, on average, received regular UI benefits.
The Joss Whedon script for Serenity, where Wash lives, is Serenity-190pages.pdf at www.mediafire.com/folder/1uwh75oa407q8/Firefly
lol. Um.... nope.
And 60-70 million Americans aren't even old enough to work so they obviously don't even count.
Do Right, Be Right. :)
NOTIFY: Y | REPLY | REPLY WITH QUOTE | PERMALINK | TOP | HOME
Quote:
Originally posted by second:Quote:When the Bureau of Labor Statistics asks, tell them the truth: Do you got a job? Or are you in jail, in the army, in a mental institution (those last 3 don't count as being employed), whatever. "Each month, highly trained and experienced Census Bureau employees contact the 60,000 eligible sample households and ask about the labor force activities (jobholding and job seeking) or non-labor force status of the members of these households. These are live interviews conducted either in person or over the phone." - www.bls.gov/cps/cps_htgm.pdf
Originally posted by JEWELSTAITEFAN:
Are the Long-term Unemployed counted among the Marginally Attached to the Labor Force, or counted among the Labor Force, or not counted among either?
That's how unemployment is calculated -- the Bureau of Labor Statistics asks Americans questions. The process cannot produce an incorrect unemployment rate if Americans tell the truth about working or not.
This is an interesting figure:
www.bls.gov/charts/employment-situation/persons-not-in-the-labor-force
-who-want-a-job.htm
Again, the figure cannot be wrong if Americans tell the truth about wanting a job.
The Joss Whedon script for Serenity, where Wash lives, is Serenity-190pages.pdf at www.mediafire.com/folder/1uwh75oa407q8/Firefly
That's making a hell of a lot of assumptions.
First off, only somewhere around 1-5% of Americans even answer any robo-calls and stick around long enough to talk to anybody on the other side once they figure out who it is.
The people being polled can lie, the bureau can lie, politicians can lie. There is no way of verifying any of this is true at all, so they can make up whatever numbers they want. There is ZERO math involved in what you are proposing is the way that unemployment is calculated. All you are doing is bolstering my argument that the unemployment numbers are total bullshit.
Remember, these were the very same tactics that were used when polling for who was going to be voted in for President. Look how accurate those polls were.
Do Right, Be Right. :)
NOTIFY: Y | REPLY | REPLY WITH QUOTE | PERMALINK | TOP | HOME
Quote:6ix, you never did click the link and read, did you? If you had: "The survey is designed so that each person age 16 and over (there is no upper age limit) is counted and classified in only one group. The sum of the employed and the unemployed constitutes the civilian labor force." If an American is between 16 and 116, they are counted as employed if they say they are employed when the Bureau of Labor Statistics asks them: "Are you employed or not?" Below 16 does not count. If you tell the Bureau you do not want to work then you do not count. The Bureau takes your word as truth of whether you are employed, not employed, or the third group: out-of-the-work-force-by-your-own-choice-because-work-sucks-and-you-refuse-to-be-a-wage-slave-and-cannot-live-chained-to-a-job.
Originally posted by 6IXSTRINGJACK:
lol. Um.... nope.
And 60-70 million Americans aren't even old enough to work so they obviously don't even count.
www.bls.gov/cps/cps_htgm.pdf
NOTIFY: Y | REPLY | REPLY WITH QUOTE | PERMALINK | TOP | HOME
Quote:The Bureau of Labor Statistics polls 110,000 people. A political survey might be hundreds. And if you lie about being employed when you are not, well, you are employed. What is the Bureau to do about assholes that lie about everything? Give 'em job? Let the liars stay unemployed.
Originally posted by 6IXSTRINGJACK:
That's making a hell of a lot of assumptions.
First off, only somewhere around 1-5% of Americans even answer any robo-calls and stick around long enough to talk to anybody on the other side once they figure out who it is.
The people being polled can lie, the bureau can lie, politicians can lie. There is no way of verifying any of this is true at all, so they can make up whatever numbers they want. There is ZERO math involved in what you are proposing is the way that unemployment is calculated. All you are doing is bolstering my argument that the unemployment numbers are total bullshit.
Remember, these were the very same tactics that were used when polling for who was going to be voted in for President. Look how accurate those polls were.
The Joss Whedon script for Serenity, where Wash lives, is Serenity-190pages.pdf at www.mediafire.com/folder/1uwh75oa407q8/Firefly
NOTIFY: Y | REPLY | REPLY WITH QUOTE | PERMALINK | TOP | HOME
Quote:
Originally posted by second:Quote:6ix, you never did click the link and read, did you? If you had: "The survey is designed so that each person age 16 and over (there is no upper age limit) is counted and classified in only one group. The sum of the employed and the unemployed constitutes the civilian labor force." If an American is between 16 and 116, they are counted as employed if they say they are employed when the Bureau of Labor Statistics asks them: "Are you employed or not?" Below 16 does not count. If you tell the Bureau you do not want to work then you do not count. The Bureau takes your word as truth of whether you are employed, not employed, or the third group: out-of-the-work-force-by-your-own-choice-because-work-sucks-and-you-refuse-to-be-a-wage-slave-and-cannot-live-chained-to-a-job.
Originally posted by 6IXSTRINGJACK:
lol. Um.... nope.
And 60-70 million Americans aren't even old enough to work so they obviously don't even count.
www.bls.gov/cps/cps_htgm.pdf
I'm not talking about the link. I'm talking about your figure of 330+ million Americans, which included children.
Do Right, Be Right. :)
NOTIFY: Y | REPLY | REPLY WITH QUOTE | PERMALINK | TOP | HOME
Quote:
Originally posted by second:Quote:The Bureau of Labor Statistics polls 110,000 people. A political survey might be hundreds. And if you lie about being employed when you are not, well, you are employed. What is the Bureau to do about assholes that lie about everything? Give 'em job? Let the liars stay unemployed.
Originally posted by 6IXSTRINGJACK:
That's making a hell of a lot of assumptions.
First off, only somewhere around 1-5% of Americans even answer any robo-calls and stick around long enough to talk to anybody on the other side once they figure out who it is.
The people being polled can lie, the bureau can lie, politicians can lie. There is no way of verifying any of this is true at all, so they can make up whatever numbers they want. There is ZERO math involved in what you are proposing is the way that unemployment is calculated. All you are doing is bolstering my argument that the unemployment numbers are total bullshit.
Remember, these were the very same tactics that were used when polling for who was going to be voted in for President. Look how accurate those polls were.
The Joss Whedon script for Serenity, where Wash lives, is Serenity-190pages.pdf at www.mediafire.com/folder/1uwh75oa407q8/Firefly
No. It doesn't poll 110,000 people. Assuming they even bother to call 110,000 people, almost nobody is going to pick up the phone and of those that do only a very tiny fraction will co-operate with the poll.
It doesn't matter if the people on the phone lie, or even what they say about it. There is no way to track who answered what and that information has never been made available and transparent to the public.
If you're going to keep up with this line of dialogue on how the information is collected, then you're only proving my argument true. Since math is not used at all via this very unscientific method, there is no way anybody could look at those figures and believe them to be true.
It's a political tool, nothing more and nothing less. The Democrats can celebrate the numbers when they're in and demonize them when they're out. Same for Republicans.
Trump called them bullshit before he was President. Now he celebrates them.
They're still bullshit, Mr. President.
Do Right, Be Right. :)
NOTIFY: Y | REPLY | REPLY WITH QUOTE | PERMALINK | TOP | HOME
BLS does a horrendous job of identifying and defining their stats. Second was helpful above by linking to a different page that provided definition, which the raw data table did not. So BLS currently defines the Want A Job category as not being part of the Labor Force.
I have re-done the first post with this new information.
The numbers are called Unemployment figures, and those are regularly redefined. At one time Active Duty Military Personnel were classified as unemployed. Obama's BLS has worked diligently to obfuscate the dismal performance of Obamanomics.
So I will post some actual numbers and let the comparisons and discussion follow. The documented shenanigans of Obamabots deliberately refusing to Report jobless data in the months before the 2012 Election are a different matter, I will just use the Fake Data they produced and pretend it was real.
The BLS uses both Seasonally Adjusted figures and Unadjusted figures, and interchanges them without clearly identifying so. For example, the current Rate of 4.1% (for 4 months straight) is SeasAdj, and the real Rate is 4.5% for Jan 2018. I will use only the Unadjusted numbers, to help maintain clarity and transparency.
Some numbers may have a 0 placed as first digit, to maintain column form in this format.
The 1st column of numbers is the unemployed. The 2nd column is the Rate.
The 3rd column is what is called the Want A Job Now category but is NOT included in the Labor Force category and therefore excluded from the reported Unemployment category. The 5th column is the sum of Unemployed plus Want A Job - which more accurately represents the Actual Unemployed. The 6th column is the Rate for column 5 figure.
The 7th column is the Involuntary Part-Time workers, who are Not Employed Full Time due to poor Economy, and want, are able to work FT. The 8th column is the sum of the 5th column plus 7th column. 9th column is the Rate for column 8 figure.
The 10th column is the Civilian Population. 11th column is Labor Force, 12th column is Participation Rate.
Figures in thousands.
Mo/Year Unemp Pcnt WAJb Pcnt SubTtl Prcnt InvPT Pcnt Total Percnt CivPop LbrForc Prtc%
Jan2008 08221 05.4% 4977 3.2% 13198 08.6% 5235 3.5% 18433 12.1% 232616 152828 65.7
Jan2009 13009 08.5% 5866 3.8% 18875 12.3% 8675 5.7% 27550 18.0% 234739 153445 65.4
Jan2010 16147 10.6% 6108 4.0% 22255 14.6% 9161 5.9% 31416 20.5% 236832 152957 64.6
Jan2011 14937 09.8% 6643 4.3% 21580 14.1% 9027 6.0% 30607 20.1% 238704 152536 63.9
Jan2012 13541 08.8% 6495 4.3% 20036 13.1% 8747 5.7% 28783 18.8% 242269 153485 63.4
Jan2013 13181 08.5% 6781 4.4% 19962 12.9% 8506 5.5% 28468 18.4% 244663 154794 63.3
Jan2014 10855 07.0% 6508 4.2% 17363 11.2% 7617 5.0% 24980 16.2% 246915 154381 62.5
Jan2015 09498 06.1% 6467 4.1% 15965 10.2% 7125 4.6% 23090 14.8% 249723 156050 62.5
Jan2016 08309 05.3% 6166 3.9% 14475 09.2% 6234 4.0% 20709 13.2% 252397 157347 62.3
Jan2017 08149 05.1% 5934 3.8% 14083 08.9% 6127 3.8% 20210 12.7% 254082 158676 62.5
Jan2018 07189 04.5% 5364 3.3% 12553 07.8% 5380 3.4% 17933 11.2% 256780 160037 62.3%
Jul 2012 13400 08.6% 6837 4.3% 20237 12.9% 8218 5.3% 28455 18.2% 243354 156526 64.3
Aug2012 12696 08.2% 7631 4.9% 20327 13.1% 7723 5.0% 28050 18.1% 243566 155255 63.7
Sep2012 11742 07.6% 6427 4.1% 18169 11.7% 8003 5.2% 26172 16.9% 243772 155075 63.6
Oct2012 11741 07.5% 6142 4.0% 17883 11.5% 7768 5.0% 25651 16.5% 243983 155779 63.8
Nov2012 11404 07.4% 6495 4.2% 17899 11.6% 7898 5.0% 25797 16.6% 244174 154953 63.5
Comparing to The Great Depression: the Unemployment peaked in 1933 at 24.75% with 12.830 Million unemployed. In 1932 there were 12.060 M unemployed, and 11.340M in 1934, 10.610 in 1935.
The 5 year stretch from 2009 to 2014 exceeded 12.9 Million each year, more Unemployed than the Great Depression. And 2014-2017 was only less with the Fake figure, but including Want A Job was still more than Great Depression, until 2018.
2010 and 2011 had Total percentages (over 20%) greater than every Great Depression year except 1933 & 1934.
The Civilian Adult Popul
NOTIFY: Y | REPLY | REPLY WITH QUOTE | PERMALINK | TOP | HOME
Quote:Your first issue is Underemployment, which is comprised of 3 components.
Originally posted by 6IXSTRINGJACK:
If you'd like to look into it a bit yourself, I suggest looking at Underemployment as a starter. It's probably the biggest factor in why the current unemployment rate statistics are a lie.Quote:
Underemployment (or disguised unemployment) is the under-use of a worker due to a job that does not use the worker's skills, or is part time, or leaves the worker idle. Examples include holding a part-time job despite desiring full-time work, and overqualification, where the employee has education, experience, or skills beyond the requirements of the job
https://en.wikipedia.org/wiki/Underemployment
Probably the second largest reason the unemployment numbers are a lie is because they only count people who are actively handing in reports every week about their unemployment status to draw an unemployment check.
My last unemployment stint was just under 2 1/2 years long. Only 6 months of that time I was considered unemployed. Now that I have a part-time job that number didn't change at all, simply because I already was considered not part of unemployment for that reason. However, had I gotten that part time job immediately after being laid off from my great full time job I would not be considered unemployed (and they don't ever factor underemployment in the statistics that are presented to the public).
This second part is something that Trump used to talk about when he said the unemployment numbers were bullshit before he was president. Funny how he doesn't talk about that anymore though, innit?
Do Right, Be Right. :)
One component is Involuntary Part-Time employment, which I have already included.
The other 2 components are Overstaffing and Overqualified. Neither of these have been reported by BLS as far as I can find. With no history of these concepts being represented or reported as being parts of Unemployment data, it is not reasonable to imagine that the data is or was falsely misrepresented with these concepts. If the Unemployment figures have been reported through history without ever considering these ideas, then continuing to Report figures under the same standards is not a plausible claim of Fake Data.
Your second issue is non-reporting Unemployed, which is a category included in the Want A Job category, and I have included this category in my table.
NOTIFY: Y | REPLY | REPLY WITH QUOTE | PERMALINK | TOP | HOME
Do you agree with Second's assessment that they get the data by calling 110,000 households per month?
If you do, I'll ask you a simple question.
Why do you suppose they would do that when they've already proven themselves perfectly capable of figuring how much money everyone was making, whether they were employed or self employed, back in the days when they gave us our social security reports that detailed exactly how much money we made every year, how much we paid into social security, and how much we would get per month depending on which age we decided to retire?
They already have that data, presented it to us on a yearly basis using actual MATH, and have been able to compile it for decades. Why waste what must be millions or even 10's of millions of dollars per year doing something as unscientific as random robo-calls on a very small percentage of citizens if they already had nearly 100% of the data just because of our income taxes and social security payments?
My answer is, because they can just make up anything they want to when there is no actual math being used.
Do Right, Be Right. :)
NOTIFY: Y | REPLY | REPLY WITH QUOTE | PERMALINK | TOP | HOME
Here's an example of what those mailers look like if you forgot. Page 3 being the most important part with all of the information they'd need to determine everything without making a single phone call. (I only put up to page 3, but you can get the rest at the link on the bottom).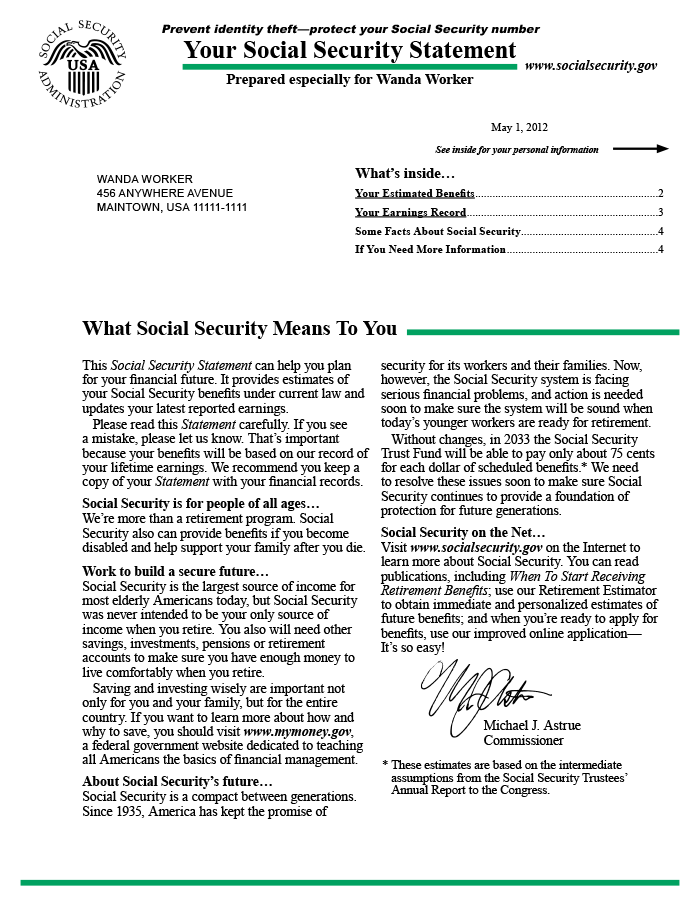
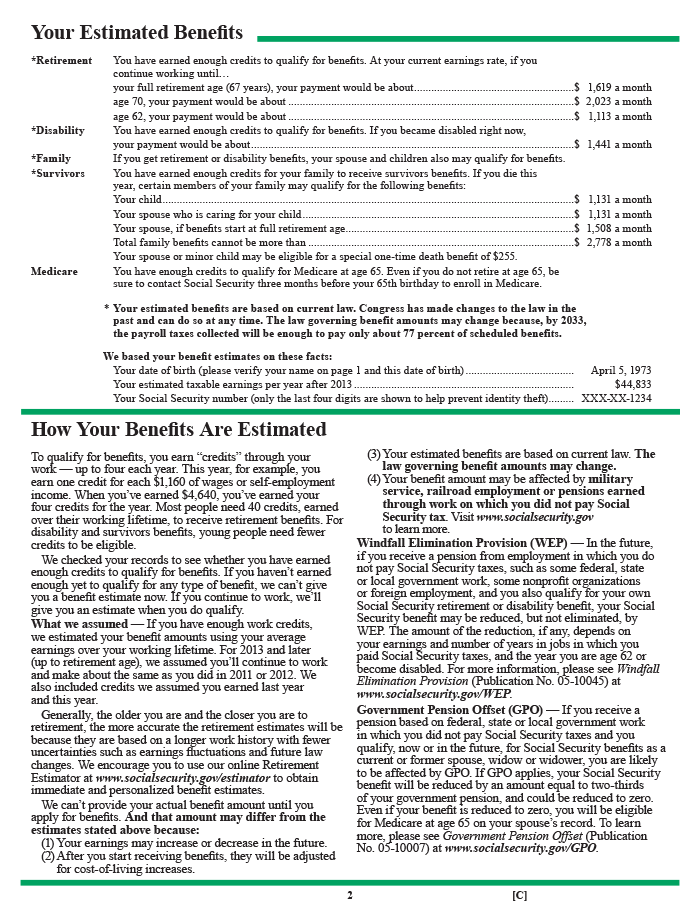
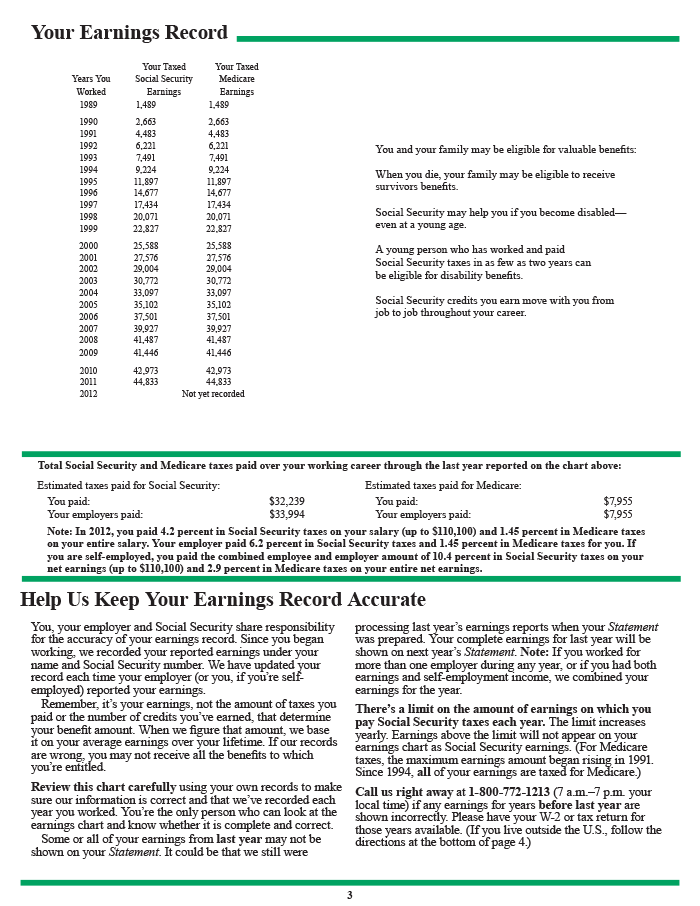
https://www.ssa.gov/policy/docs/ssb/v74n2/v74n2p1.html
Quote:
In recent years, funding constraints and technological developments have brought major changes to the Statement. In February 2012, SSA resumed mailing printed Statements to workers aged 60 or older, following a suspension that began in March 2011 to conserve agency funds. Then, in May 2012, SSA introduced an online version of the Statement. The agency also made a one-time mailing of the Statement in July to workers aged 25 in 2012. In October 2012, SSA again suspended Statement mailings for budgetary reasons, and relied on the online version to provide workers with immediate access to their earnings records, estimated benefits, and other information. In September 2014, the agency resumes mailing a revised and redesigned version of the printed Statement to workers of selected ages.
I wasn't even aware that you could get these statements online. I thought they had stopped mailing them out around the time they were telling people under 55 that they wouldn't even get social security when they retire. You learn something new everyday.
I can't wait to see mine. My income is like a rollercoaster when viewed over the years. Good on Wanda Worker in the sample document. Somehow she's managed to increase her earnings every single year of her working life. I bet most people's statements don't look so neat.
Do Right, Be Right. :)
NOTIFY: Y | REPLY | REPLY WITH QUOTE | PERMALINK | TOP | HOME
Quote:If the Bureau of Labor Statistics depended on W-2 forms that businesses send to the Internal Revenue Service only once per year and quarterly income tax withholding, their numbers wouldn't be any good for a monthly estimation. Also the Bureau does not want an estimate based on who is avoiding paying any income tax at all. And the Bureau wants more information that the IRS will never receive. There is a news release from the Bureau giving charts & tables full of numbers. Two answers to some questions about the tables www.bls.gov/news.release/pdf/empsit.pdf :
Originally posted by 6IXSTRINGJACK:
Do you agree with Second's assessment that they get the data by calling 110,000 households per month?
If you do, I'll ask you a simple question.
Why do you suppose they would do that when they've already proven themselves perfectly capable of figuring how much money everyone was making, whether they were employed or self employed, back in the days when they gave us our social security reports that detailed exactly how much money we made every year, how much we paid into social security, and how much we would get per month depending on which age we decided to retire?
They already have that data, presented it to us on a yearly basis using actual MATH, and have been able to compile it for decades. Why waste what must be millions or even 10's of millions of dollars per year doing something as unscientific as random robo-calls on a very small percentage of citizens if they already had nearly 100% of the data just because of our income taxes and social security payments?
My answer is, because they can just make up anything they want to when there is no actual math being used.
Do Right, Be Right. :)
6. Is the count of unemployed persons limited to just those people receiving unemployment insurance benefits?
No; the estimate of unemployment is based on a monthly sample survey of households. All persons who are without jobs and are actively seeking and available to work are included among the unemployed. (People on temporary layoff are included even if they do not actively seek work.) There is no requirement or question relating to unemployment insurance benefits in the monthly survey.
7. Does the official unemployment rate exclude people who want a job but are not currently looking for work?
Yes; however, there are separate estimates of persons outside the labor force who want a job, including those who are not currently looking because they believe no jobs are available (discouraged workers). In addition, alternative measures of labor underutilization (some of which include discouraged workers and other groups not officially counted as unemployed) are published each month in table A-15 of The Employment Situation news release. For more information about these alternative measures, please visit www.bls.gov/cps/lfcharacteristics.htm#altmeasures
The Joss Whedon script for Serenity, where Wash lives, is Serenity-190pages.pdf at www.mediafire.com/folder/1uwh75oa407q8/Firefly
NOTIFY: Y | REPLY | REPLY WITH QUOTE | PERMALINK | TOP | HOME
BLS uses at least 2 channels of data collection. One is the household sampling. Another is institutional, which is largely automated, and is provided by employers and the like. During a Government Shutdown the household data collection is suspended but the institutional data continues to roll in.
There are statistical methods for corralling accurate figures from gathered information. When Obama fraudulently manipulated the data in 2012 to miraculously and suddenly lower the reported Unemployment Rates before Election Day, he then allowed the data to return to unmolested levels.
NOTIFY: Y | REPLY | REPLY WITH QUOTE | PERMALINK | TOP | HOME
Quote:I am looking at the XLS file, and I can’t see the Obama conspiracy you see.
Originally posted by JEWELSTAITEFAN:
When Obama fraudulently manipulated the data in 2012 to miraculously and suddenly lower the reported Unemployment Rates before Election Day, he then allowed the data to return to unmolested levels.
If you got something, show me, JewelStaiteFan. Going from 7.8% to 7.7% to 7.9% around the election is not showing me Obama "molesting" the data.
xls file: https://goo.gl/cUv5zQ
2012-06-01 8.2 134026
2012-07-01 8.2 134182
2012-08-01 8.1 134355
2012-09-01 7.8 134549
2012-10-01 7.8 134702
2012-11-01 7.7 134832
2012-12-01 7.9 135075
2013-01-01 8.0 135282
2013-02-01 7.7 135547
2013-03-01 7.5 135703
2013-04-01 7.6 135882
2013-05-01 7.5 136122
2013-06-01 7.5 136280
The Joss Whedon script for Serenity, where Wash lives, is Serenity-190pages.pdf at www.mediafire.com/folder/1uwh75oa407q8/Firefly
NOTIFY: Y | REPLY | REPLY WITH QUOTE | PERMALINK | TOP | HOME
Quote:
Originally posted by second:
If the Bureau of Labor Statistics depended on W-2 forms that businesses send to the Internal Revenue Service only once per year and quarterly income tax withholding, their numbers wouldn't be any good for a monthly estimation.
I thought of that after I made the post, and I figured you'd bring it up.
Fair enough. But they should use it once per year to prove that their monthly rates are bullshit.
Bullshit polls and manipulated facts can't stand up to actual math.
This would be the reason they don't even bother checking the data they already have and comparing it against their robo-calls. One single year of doing so would blow the lid off the whole corrupt deal.
Bottom line, the proof is in how our two parties handle unemployment. Whoever is in power says the numbers are great. Whoever is not in power says the numbers are not honest. Pay attention in 3 or 7 years when the pendulum swings the other way and remember this conversation.
Do Right, Be Right. :)
NOTIFY: Y | REPLY | REPLY WITH QUOTE | PERMALINK | TOP | HOME
I used a different computer today and saw the table I made was disjointed, perhaps what 6ix was talking about.
So I am reposting the table here, broken into 2 parts.
BLS does a horrendous job of identifying and defining their stats. Second was helpful above by linking to a different page that provided definition, which the raw data table did not. So BLS currently defines the Want A Job category as not being part of the Labor Force.
I have re-done the first post with this new information.
The numbers are called Unemployment figures, and those are regularly redefined. At one time Active Duty Military Personnel were classified as unemployed. Obama's BLS has worked diligently to obfuscate the dismal performance of Obamanomics.
So I will post some actual numbers and let the comparisons and discussion follow. The documented shenanigans of Obamabots deliberately refusing to Report jobless data in the months before the 2012 Election are a different matter, I will just use the Fake Data they produced and pretend it was real.
The BLS uses both Seasonally Adjusted figures and Unadjusted figures, and interchanges them without clearly identifying so. For example, the current Rate of 4.1% (for 4 months straight) is SeasAdj, and the real Rate is 4.5% for Jan 2018. I will use only the Unadjusted numbers, to help maintain clarity and transparency.
Some numbers may have a 0 placed as first digit, to maintain column form in this format.
The 1st column of numbers is the unemployed. The 2nd column is the Rate.
The 3rd column is what is called the Want A Job Now category but is NOT included in the Labor Force category and therefore excluded from the reported Unemployment category. The 5th column is the sum of Unemployed plus Want A Job - which more accurately represents the Actual Unemployed. The 6th column is the Rate for column 5 figure.
The 7th column is the Involuntary Part-Time workers, who are Not Employed Full Time due to poor Economy, and want, are able to work FT. The 8th column is the sum of the 5th column plus 7th column. 9th column is the Rate for column 8 figure.
The 10th column is the Civilian Population. 11th column is Labor Force, 12th column is Participation Rate.
Figures in thousands.
Mo/Year Unemp Pcnt WAJb Pcnt SubTtl Prcnt InvPT Pcnt Total Percnt
Jan2008 08221 05.4% 4977 3.2% 13198 08.6% 5235 3.5% 18433 12.1%
Jan2009 13009 08.5% 5866 3.8% 18875 12.3% 8675 5.7% 27550 18.0%
Jan2010 16147 10.6% 6108 4.0% 22255 14.6% 9161 5.9% 31416 20.5%
Jan2011 14937 09.8% 6643 4.3% 21580 14.1% 9027 6.0% 30607 20.1%
Jan2012 13541 08.8% 6495 4.3% 20036 13.1% 8747 5.7% 28783 18.8%
Jan2013 13181 08.5% 6781 4.4% 19962 12.9% 8506 5.5% 28468 18.4%
Jan2014 10855 07.0% 6508 4.2% 17363 11.2% 7617 5.0% 24980 16.2%
Jan2015 09498 06.1% 6467 4.1% 15965 10.2% 7125 4.6% 23090 14.8%
Jan2016 08309 05.3% 6166 3.9% 14475 09.2% 6234 4.0% 20709 13.2%
Jan2017 08149 05.1% 5934 3.8% 14083 08.9% 6127 3.8% 20210 12.7%
Jan2018 07189 04.5% 5364 3.3% 12553 07.8% 5380 3.4% 17933 11.2%
Jul 2012 13400 08.6% 6837 4.3% 20237 12.9% 8218 5.3% 28455 18.2%
Aug2012 12696 08.2% 7631 4.9% 20327 13.1% 7723 5.0% 28050 18.1%
Sep2012 11742 07.6% 6427 4.1% 18169 11.7% 8003 5.2% 26172 16.9%
Oct2012 11741 07.5% 6142 4.0% 17883 11.5% 7768 5.0% 25651 16.5%
Nov2012 11404 07.4% 6495 4.2% 17899 11.6% 7898 5.0% 25797 16.6%
Mo/Year Unemp Pcnt WAJb Pcnt Total Percnt CivPop LbrForc Prtc%
Jan2008 08221 05.4% 4977 3.2% 18433 12.1% 232616 152828 65.7
Jan2009 13009 08.5% 5866 3.8% 27550 18.0% 234739 153445 65.4
Jan2010 16147 10.6% 6108 4.0% 31416 20.5% 236832 152957 64.6
Jan2011 14937 09.8% 6643 4.3% 30607 20.1% 238704 152536 63.9
Jan2012 13541 08.8% 6495 4.3% 28783 18.8% 242269 153485 63.4
Jan2013 13181 08.5% 6781 4.4% 28468 18.4% 244663 154794 63.3
Jan2014 10855 07.0% 6508 4.2% 24980 16.2% 246915 154381 62.5
Jan2015 09498 06.1% 6467 4.1% 23090 14.8% 249723 156050 62.5
Jan2016 08309 05.3% 6166 3.9% 20709 13.2% 252397 157347 62.3
Jan2017 08149 05.1% 5934 3.8% 20210 12.7% 254082 158676 62.5
Jan2018 07189 04.5% 5364 3.3% 179
NOTIFY: Y | REPLY | REPLY WITH QUOTE | PERMALINK | TOP | HOME
Quote:I'm not sure how gullible you might be trying to be, or if you're trying to ignore the data.
Originally posted by second:Quote:I am looking at the XLS file, and I can’t see the Obama conspiracy you see.
Originally posted by JEWELSTAITEFAN:
When Obama fraudulently manipulated the data in 2012 to miraculously and suddenly lower the reported Unemployment Rates before Election Day, he then allowed the data to return to unmolested levels.
If you got something, show me, JewelStaiteFan. Going from 7.8% to 7.7% to 7.9% around the election is not showing me Obama "molesting" the data.
xls file: https://goo.gl/cUv5zQ
2012-06-01 8.2 134026
2012-07-01 8.2 134182
2012-08-01 8.1 134355
2012-09-01 7.8 134549
2012-10-01 7.8 134702
2012-11-01 7.7 134832
2012-12-01 7.9 135075
2013-01-01 8.0 135282
2013-02-01 7.7 135547
2013-03-01 7.5 135703
2013-04-01 7.6 135882
2013-05-01 7.5 136122
2013-06-01 7.5 136280
In 2012 Obama knows no incumbent President since FDR has won re-election with Unemployment at 8% or higher, so he must have Unemployment reported to be below this by October 2012 - which will be published in early November before Election Day.
Comparing Jan 2012 and 2013 with other Jan data shows CivPop, Labor Force, Unemployment count and Rate, and Involuntary Part-Time to be in adequate alignment and trend, and these are all data components compiled from institutional reports.
The first half of 2012 the numbers are not heading where Obama needs them fast enough. So in Aug, Sep, Oct the figures suddenly and miraculously become what Obama needs. Then the figures return to reality in following months.
We see in August that the pretense of Unemployment Rate at 75% of what it was a couple years before is undermined by the fact that the Want A Job count is the highest it has ever been, which it has never been above 7 Million. This is how they present the illusion of the worst ever Want A Job count equaling a 25% drop in the Official Unemployment.
Mo/Year Unemp Pcnt WAJb Pcnt SubTtl Prcnt InvPT Pcnt Total Percnt CivPop LbrForc Prtc%
Jan2008 08221 05.4% 4977 3.2% 13198 08.6% 5235 3.5% 18433 12.1% 232616 152828 65.7
Jan2009 13009 08.5% 5866 3.8% 18875 12.3% 8675 5.7% 27550 18.0% 234739 153445 65.4
Jan2010 16147 10.6% 6108 4.0% 22255 14.6% 9161 5.9% 31416 20.5% 236832 152957 64.6
Jan2011 14937 09.8% 6643 4.3% 21580 14.1% 9027 6.0% 30607 20.1% 238704 152536 63.9
Jan2012 13541 08.8% 6495 4.3% 20036 13.1% 8747 5.7% 28783 18.8% 242269 153485 63.4
Jul 2012 13400 08.6% 6837 4.3% 20237 12.9% 8218 5.3% 28455 18.2% 243354 156526 64.3
Aug2012 12696 08.2% 7631 4.9% 20327 13.1% 7723 5.0% 28050 18.1% 243566 155255 63.7
Sep2012 11742 07.6% 6427 4.1% 18169 11.7% 8003 5.2% 26172 16.9% 243772 155075 63.6
Oct2012 11741 07.5% 6142 4.0% 17883 11.5% 7768 5.0% 25651 16.5% 243983 155779 63.8
Nov2012 11404 07.4% 6495 4.2% 17899 11.6% 7898 5.0% 25797 16.6% 244174 154953 63.5
Jan2013 13181 08.5% 6781 4.4% 19962 12.9% 8506 5.5% 28468 18.4% 244663 153794 63.3
NOTIFY: Y | REPLY | REPLY WITH QUOTE | PERMALINK | TOP | HOME

Lets remember SECOND. We are dealing with people who live in the world of conspiracies. They can't function without one. Once they've found one to latch onto, to rage about, they cannot be swayed. Even when the proof is irrefutable.
Like the fact that the numbers show the truth. Obama is responsible for delivering a better economy so far than Trump. Even when Obama inherited a much much worse economy. It's very sad...
T 
NOTIFY: Y | REPLY | REPLY WITH QUOTE | PERMALINK | TOP | HOME
lol... every post you make in here is about a conspiracy T.
Do Right, Be Right. :)
NOTIFY: Y | REPLY | REPLY WITH QUOTE | PERMALINK | TOP | HOME
Updated with today's report:
Quote:
Originally posted by JEWELSTAITEFAN:
BLS currently defines the Want A Job category as not being part of the Labor Force.
So I will post some actual numbers and let the comparisons and discussion follow. The documented shenanigans of Obamabots deliberately refusing to Report jobless data in the months before the 2012 Election are a different matter, I will just use the Fake Data they produced and pretend it was real.
I will use only the Unadjusted numbers, to help maintain clarity and transparency.
Mo/Yr Unemp Pcnt WAJb Pcnt SubTtl Prcnt InvPT Pcnt Total Percnt CivPop LbrForc Prtc% U-6%
Jan08 08221 05.4% 4977 3.2% 13198 08.6% 5235 3.5% 18433 12.1% 232616 152828 65.7 09.9
Jan09 13009 08.5% 5866 3.8% 18875 12.3% 8675 5.7% 27550 18.0% 234739 153445 65.4 15.4
Jan10 16147 10.6% 6108 4.0% 22255 14.6% 9161 5.9% 31416 20.5% 236832 152957 64.6 18.0
Jan11 14937 09.8% 6643 4.3% 21580 14.1% 9027 6.0% 30607 20.1% 238704 152536 63.9 17.3
Jan12 13541 08.8% 6495 4.3% 20036 13.1% 8747 5.7% 28783 18.8% 242269 153485 63.4 16.2
Jan13 13181 08.5% 6781 4.4% 19962 12.9% 8506 5.5% 28468 18.4% 244663 154794 63.3 15.4
Jan14 10855 07.0% 6508 4.2% 17363 11.2% 7617 5.0% 24980 16.2% 246915 154381 62.5 13.5
Jan15 09498 06.1% 6467 4.1% 15965 10.2% 7125 4.6% 23090 14.8% 249723 156050 62.5 12.0
Jan16 08309 05.3% 6166 3.9% 14475 09.2% 6234 4.0% 20709 13.2% 252397 157347 62.3 10.5
Jan17 08149 05.1% 5934 3.8% 14083 08.9% 6127 3.8% 20210 12.7% 254082 158676 62.5 10.1
Jan18 07189 04.5% 5364 3.3% 12553 07.8% 5380 3.4% 17933 11.2% 256780 160037 62.3 08.9
Feb18 07091 04.4% 5152 3.2% 12243 07.6% 5241 3.2% 17484 10.8% 256934 161494 62.9 08.6
Jul 12 13400 08.6% 6837 4.3% 20237 12.9% 8218 5.3% 28455 18.2% 243354 156526 64.3 15.2
Aug12 12696 08.2% 7631 4.9% 20327 13.1% 7723 5.0% 28050 18.1% 243566 155255 63.7 14.6
Sep12 11742 07.6% 6427 4.1% 18169 11.7% 8003 5.2% 26172 16.9% 243772 155075 63.6 14.2
Oct12 11741 07.5% 6142 4.0% 17883 11.5% 7768 5.0% 25651 16.5% 243983 155779 63.8 13.9
Nov12 11404 07.4% 6495 4.2% 17899 11.6% 7898 5.0% 25797 16.6% 244174 154953 63.5 13.9
Quote:
The Civilian Adult Population steadily Increases, suggesting that figure is not manipulated.
The Unemployment Rate after 2008 was able to be artificially less by shifting more unemployed into the Want A Job category, which Obamanomics managed to increase to over 7 Million for the only time in the BLS tables. This Jan figure (Want A Job) didn't return to within 0.1% of 2008 level until 2018, after Trump's first year.
The figure of Unemployed plus Want A Job is indisputably the real Unfake Unemployment figure.
The Labor Force Participation Rate steadily dropped each year until finally reversing in 2017, Trump's first year.
The Want A Job count maxxed out in Aug 2012, just as Obama was proclaiming that Unemployment Rates had dropped, which he needed to get below 8.0% by October, in order to win re-election.
NOTIFY: Y | REPLY | REPLY WITH QUOTE | PERMALINK | TOP | HOME
Unemployment/Underemployment hasn't been under 8% since at least 2000.
https://www.thebalance.com/what-is-the-real-unemployment-rate-3306198
Quote:
The real unemployment rate (U-6) is a broader definition of unemployment than the official unemployment rate (U-3). In February 2018, it remained at 8.2 percent.
The U-3 is the rate most often reported in the media. In the U-3 rate, the Bureau of Labor Statistics only counts people without jobs who are in the labor force. To remain in the labor force, they must have looked for a job in the last four weeks.
The U-6, or real unemployment rate, includes the underemployed, the marginally attached, and discouraged workers. For that reason, it is almost double the U-3 report.
EDIT: My bad... according to this table, it's been over 8% since 2002.
Year---(U3)-----(U6)---(U3/U6)--(Comments)
1994 6.6% 11.8% 56% The first year BLS reported U6
1995 5.6% 10.2% 55%
1996 5.6% 9.8% 57%
1997 5.3% 9.4% 56%
1998 4.6% 8.4% 55%
1999 4.3% 7.7% 56%
2000 4.0% (Record Low) 7.1% 56% Stock market crashed in March
2001 4.2% 7.3% 58%
2002 5.7% 9.5% 60% U3 closest to U6
2003 5.8% 10.0% 58%
2004 5.7% 9.9% 58%
2005 5.3% 9.3% 57%
2006 4.7% 8.4% 56%
2007 4.6% 8.4% 55%
2008 5.0% 9.2% 54%
2009 7.8% 14.2% 55% High of 10.2% in Oct
2010 9.8% 16.7% 59%
2011 9.1% 16.2% 56%
2012 8.3% 15.2% 55%
2013 8.0% 14.5% 55%
2014 6.6% 12.7% 52%
2015 5.7% 11.3% 50%
2016 4.9% 9.9% 49% Both return to pre-recession levels
2017 4.8% 9.4% 51%
2018 4.4% 8.2% 50%
Man... fff.net is terrible at showing tables.
Quote:
The point is to make sure you compare apples to apples. If you say the government is lying during a recession, then you've got to make the same argument when times are good.
Do Right, Be Right. :)
NOTIFY: Y | REPLY | REPLY WITH QUOTE | PERMALINK | TOP | HOME
That U-6 data is hidden pretty well. I added the data to my earlier post. Found it in Table A-15 after 2010.
Your table is littered with Libtard BS.
Stock Market Crash in March 2000? Do you believe that?
And 3.8 is the lowest differential, while the prior 2 years are 3.1% - Libtard Maths at work.
And 9.9% us as low as 8.4% - more Libtard Maths at work. Sheesh.
NOTIFY: Y | REPLY | REPLY WITH QUOTE | PERMALINK | TOP | HOME
Updated with today's report:
Quote:
Originally posted by JEWELSTAITEFAN:
BLS currently defines the Want A Job category as not being part of the Labor Force.
So I will post some actual numbers and let the comparisons and discussion follow. The documented shenanigans of Obamabots deliberately refusing to Report jobless data in the months before the 2012 Election are a different matter, I will just use the Fake Data they produced and pretend it was real.
I will use only the Unadjusted numbers, to help maintain clarity and transparency.
Mo/Yr Unemp Pcnt WAJb Pcnt SubTtl Prcnt InvPT Pcnt Total Percnt CivPop LbrForc Prtc% U-6%
Jan08 08221 05.4% 4977 3.2% 13198 08.6% 5235 3.5% 18433 12.1% 232616 152828 65.7 09.9
Jan09 13009 08.5% 5866 3.8% 18875 12.3% 8675 5.7% 27550 18.0% 234739 153445 65.4 15.4
Jan10 16147 10.6% 6108 4.0% 22255 14.6% 9161 5.9% 31416 20.5% 236832 152957 64.6 18.0
Jan11 14937 09.8% 6643 4.3% 21580 14.1% 9027 6.0% 30607 20.1% 238704 152536 63.9 17.3
Jan12 13541 08.8% 6495 4.3% 20036 13.1% 8747 5.7% 28783 18.8% 242269 153485 63.4 16.2
Jan13 13181 08.5% 6781 4.4% 19962 12.9% 8506 5.5% 28468 18.4% 244663 154794 63.3 15.4
Jan14 10855 07.0% 6508 4.2% 17363 11.2% 7617 5.0% 24980 16.2% 246915 154381 62.5 13.5
Jan15 09498 06.1% 6467 4.1% 15965 10.2% 7125 4.6% 23090 14.8% 249723 156050 62.5 12.0
Jan16 08309 05.3% 6166 3.9% 14475 09.2% 6234 4.0% 20709 13.2% 252397 157347 62.3 10.5
Jan17 08149 05.1% 5934 3.8% 14083 08.9% 6127 3.8% 20210 12.7% 254082 158676 62.5 10.1
Jan18 07189 04.5% 5364 3.3% 12553 07.8% 5380 3.4% 17933 11.2% 256780 160037 62.3 08.9
Feb18 07091 04.4% 5152 3.2% 12243 07.6% 5241 3.2% 17484 10.8% 256934 161494 62.9 08.6
Mar18 06671 04.1% 4793 3.0% 11464 07.1% 4975 3.1% 16439 10.2% 257097 161548 62.8 08.1
Jul 12 13400 08.6% 6837 4.3% 20237 12.9% 8218 5.3% 28455 18.2% 243354 156526 64.3 15.2
Aug12 12696 08.2% 7631 4.9% 20327 13.1% 7723 5.0% 28050 18.1% 243566 155255 63.7 14.6
Sep12 11742 07.6% 6427 4.1% 18169 11.7% 8003 5.2% 26172 16.9% 243772 155075 63.6 14.2
Oct12 11741 07.5% 6142 4.0% 17883 11.5% 7768 5.0% 25651 16.5% 243983 155779 63.8 13.9
Nov12 11404 07.4% 6495 4.2% 17899 11.6% 7898 5.0% 25797 16.6% 244174 154953 63.5 13.9
Quote:
The Civilian Adult Population steadily Increases, suggesting that figure is not manipulated.
The Unemployment Rate after 2008 was able to be artificially less by shifting more unemployed into the Want A Job category, which Obamanomics managed to increase to over 7 Million for the only time in the BLS tables. This Jan figure (Want A Job) didn't return to within 0.1% of 2008 level until 2018, after Trump's first year.
The figure of Unemployed plus Want A Job is indisputably the real Unfake Unemployment figure.
The Labor Force Participation Rate steadily dropped each year until finally reversing in 2017, Trump's first year.
The Want A Job count maxxed out in Aug 2012, just as Obama was proclaiming that Unemployment Rates had dropped, which he needed to get below 8.0% by October, in order to win re-election.
NOTIFY: Y | REPLY | REPLY WITH QUOTE | PERMALINK | TOP | HOME
Deep State must be deeply embedded at BLS. Reading their report, summary says no change, little change, no difference, nothing to see here folks, these are not the improvements you are looking for, never mind that man behind the curtain.
Any way to gloss over the horrors of Obamanomics.
But the actual numbers show a whole different story. Every raw figure of bad column is now the lowest since Bush43. Every Subtotal percentage is not only lowest, but also less than half of the figures Obama generated.
And the Labor Force Participation Rate continues to be the best in years.
NOTIFY: Y | REPLY | REPLY WITH QUOTE | PERMALINK | TOP | HOME
The corporations don’t need BLS numbers. Corps don't need the unemployed to be profitable. So why hire them? You know corps aren’t run like charities for the unemployed.
www.washingtonpost.com/news/wonk/wp/2018/04/06/how-12-experts-would-en
d-inequality-if-they-ran-america/?utm_term=.4e3e366d2f37
The economy in which we live now is one where lots of business models that had once been illegal are essentially immunized from antitrust liability. Among them: vertical integration (owning multiple stages of production in the supply chain, as many telecom companies do); misclassification of employees as independent contractors; the rise of the gig economy.
As a result, corporate profits as a share of economic output have risen from less than 5 percent to more than 15 percent. They're a much larger share of national income, at the expense of both workers and traditional capital investment. If profits are high, as they are now, corporations are supposed to be expanding and investing under threat of competition. But that's not happening. They're at high profits without needing to invest, which is evidence that they don't face competition.
We need new antitrust legislation to set the policy back on track. That legislation should consist of a revision of monopolization enforcement — particularly Section 2 of the Sherman Act — since we have not seen a meaningful case brought by the government since it took action against Microsoft in the early 2000s.
Companies should face legal liability not just in the product markets but also through antitrust action in the labor market when they exert “monopsony” power. http://rooseveltinstitute.org/how-widespread-labor-monopsony-some-new-
results-suggest-its-pervasive/
The goal is to change how corporations work, to reduce their profitability and to create space for other players to compete, creating an economy that works for a wider set of stakeholders than the corporate CEOs and their shareholders. It would help reverse the decline of entrepreneurship and small-business growth and ensure the economy works for everyone.
The Joss Whedon script for Serenity, where Wash lives, is Serenity-190pages.pdf at www.mediafire.com/folder/1uwh75oa407q8/Firefly
NOTIFY: Y | REPLY | REPLY WITH QUOTE | PERMALINK | TOP | HOME
It's still not good jobs though.
It might be better than it has been during the Obama Administration, but that's not saying much at all. During most of GWB's Administration it wasn't all that great either. The job market has been taking a shit since around 2002 and hasn't ever had any meaningful recovery.
The problem right now is that even if the economy improved, there still won't be all that many great jobs to be had. Automation and Outsourcing have just taken so many of them. We'll never get the ones that automation took away back, and we won't get the ones we lost to outsourcing until these cheaper countries become so well off that our labor is competitive to theirs. That's not something we should be looking forward to.
Do Right, Be Right. :)
NOTIFY: Y | REPLY | REPLY WITH QUOTE | PERMALINK | TOP | HOME
Quote:Maybe you should repeat this to yourself a few times until you understand: American Corporations don't hire in order to reduce your unemployment. Corporations hire to increase their profits and they don't give a damn about the accuracy of the Bureau of Labor Statistics. It doesn't make Corps any money.
Originally posted by 6IXSTRINGJACK:
It's still not good jobs though.
It might be better than it has been during the Obama Administration, but that's not saying much at all. During most of GWB's Administration it wasn't all that great either. The job market has been taking a shit since around 2002 and hasn't ever had any meaningful recovery.
The problem right now is that even if the economy improved, there still won't be all that many great jobs to be had. Automation and Outsourcing have just taken so many of them. We'll never get the ones that automation took away back, and we won't get the ones we lost to outsourcing until these cheaper countries become so well off that our labor is competitive to theirs. That's not something we should be looking forward to.
Do Right, Be Right. :)
Corporations are making excellent profits now. Why would the Corps want to share all that money with the unemployed, unless it would make them even more profits? Since American Corporations are run this way, millions of people will not be getting that good paying job because that does nothing for the owners of the Corporations.
The Joss Whedon script for Serenity, where Wash lives, is Serenity-190pages.pdf at www.mediafire.com/folder/1uwh75oa407q8/Firefly
NOTIFY: Y | REPLY | REPLY WITH QUOTE | PERMALINK | TOP | HOME
Quote:
Originally posted by second:
Maybe you should repeat this to yourself a few times until you understand: American Corporations don't hire in order to reduce your unemployment. Corporations hire to increase their profits and they don't give a damn about the accuracy of the Bureau of Labor Statistics. It doesn't make Corps any money.
Corporations are making excellent profits now. Why would the Corps want to share all that money with the unemployed, unless it would make them even more profits? Since American Corporations are run this way, millions of people will not be getting that good paying job because that does nothing for the owners of the Corporations.
Why do I have to repeat anything? I'm not arguing with you.
Nothing in my post was arguing your point and actually augments your own argument.
Do Right, Be Right. :)
NOTIFY: Y | REPLY | REPLY WITH QUOTE | PERMALINK | TOP | HOME
Quote:Arguing pro or con about the accuracy of the Bureau of Labor Statistics does you no good, but why should it? The BLS serves the Feds and political parties, not you.
Originally posted by 6IXSTRINGJACK:
Why do I have to repeat anything? I'm not arguing with you.
Nothing in my post was arguing your point and actually augments your own argument.
Looking at the BLS numbers, the Feds could decide to beat the Corporations into submission so that one of them will hire you at a good wage. Or the Feds can decide to do nothing useful. Depends on who controls Congress and by the word "control" I mean 67% majority, not a measly 51%. In the range between 66% and 50%, things tend to not change for the better because of the rules of Congress, but rather devolve into chaos. At 67%, things can change fast. (See for example: WWII where more than 67% of Congress was willing to do whatever it takes to win. The Ford Corp, as one example, hated that the Feds bullied it to make B-24 bombers and hire more workers. Henry Ford refused on principle to hire women. He was bitter. He was forced to resign because he was standing in the way of what the Feds wanted.)
Whether you believe that fast change in the future is for the better or worse depends on which party you prefer. It does not matter what the BLS unemployment numbers are. Those are just for Congress and the President. If they want to do something about unemployment, then Congress and the President could use force on the Corporations. But a 67% majority in Congress does not care, and they won't in the near future, which leaves Corporations to do as they please -- maximize their profits rather than employment.
The Joss Whedon script for Serenity, where Wash lives, is Serenity-190pages.pdf at www.mediafire.com/folder/1uwh75oa407q8/Firefly
NOTIFY: Y | REPLY | REPLY WITH QUOTE | PERMALINK | TOP | HOME
Quote:Wherever your numbers are coming from, they are reading U-6 at 0.7% below the BLS figure.
Originally posted by 6IXSTRINGJACK:
Unemployment/Underemployment hasn't been under 8% since at least 2000.
https://www.thebalance.com/what-is-the-real-unemployment-rate-3306198Quote:
The real unemployment rate (U-6) is a broader definition of unemployment than the official unemployment rate (U-3). In February 2018, it remained at 8.2 percent.
The U-3 is the rate most often reported in the media. In the U-3 rate, the Bureau of Labor Statistics only counts people without jobs who are in the labor force. To remain in the labor force, they must have looked for a job in the last four weeks.
The U-6, or real unemployment rate, includes the underemployed, the marginally attached, and discouraged workers. For that reason, it is almost double the U-3 report.
EDIT: My bad... according to this table, it's been over 8% since 2002.
Year---(U3)-----(U6)---(U3/U6)--(Comments)
1994 6.6% 11.8% 56% The first year BLS reported U6
1995 5.6% 10.2% 55%
1996 5.6% 9.8% 57%
1997 5.3% 9.4% 56%
1998 4.6% 8.4% 55%
1999 4.3% 7.7% 56%
2000 4.0% (Record Low) 7.1% 56% Stock market crashed in March
2001 4.2% 7.3% 58%
2002 5.7% 9.5% 60% U3 closest to U6
2003 5.8% 10.0% 58%
2004 5.7% 9.9% 58%
2005 5.3% 9.3% 57%
2006 4.7% 8.4% 56%
2007 4.6% 8.4% 55%
2008 5.0% 9.2% 54%
2009 7.8% 14.2% 55% High of 10.2% in Oct
2010 9.8% 16.7% 59%
2011 9.1% 16.2% 56%
2012 8.3% 15.2% 55%
2013 8.0% 14.5% 55%
2014 6.6% 12.7% 52%
2015 5.7% 11.3% 50%
2016 4.9% 9.9% 49% Both return to pre-recession levels
2017 4.8% 9.4% 51%
2018 4.4% 8.2% 50%
Man... fff.net is terrible at showing tables.Quote:
The point is to make sure you compare apples to apples. If you say the government is lying during a recession, then you've got to make the same argument when times are good.
Do Right, Be Right. :)
So the newest 8.1% could be the Lowest, or 2nd or 3rd Lowest in the history of them tracking it.
But your table is still chock full of imaginary data, so it's difficult to translate facts from it.
NOTIFY: Y | REPLY | REPLY WITH QUOTE | PERMALINK | TOP | HOME
Wherever I got the data from? I linked it.
Go do some research. The data is sound. It's just not what you want to hear.
Do Right, Be Right. :)
NOTIFY: Y | REPLY | REPLY WITH QUOTE | PERMALINK | TOP | HOME
Quote:
Originally posted by second:Quote:Arguing pro or con about the accuracy of the Bureau of Labor Statistics does you no good, but why should it? The BLS serves the Feds and political parties, not you.
Originally posted by 6IXSTRINGJACK:
Why do I have to repeat anything? I'm not arguing with you.
Nothing in my post was arguing your point and actually augments your own argument.
Looking at the BLS numbers, the Feds could decide to beat the Corporations into submission so that one of them will hire you at a good wage. Or the Feds can decide to do nothing useful. Depends on who controls Congress and by the word "control" I mean 67% majority, not a measly 51%. In the range between 66% and 50%, things tend to not change for the better because of the rules of Congress, but rather devolve into chaos. At 67%, things can change fast. (See for example: WWII where more than 67% of Congress was willing to do whatever it takes to win. The Ford Corp, as one example, hated that the Feds bullied it to make B-24 bombers and hire more workers. Henry Ford refused on principle to hire women. He was bitter. He was forced to resign because he was standing in the way of what the Feds wanted.)
Whether you believe that fast change in the future is for the better or worse depends on which party you prefer. It does not matter what the BLS unemployment numbers are. Those are just for Congress and the President. If they want to do something about unemployment, then Congress and the President could use force on the Corporations. But a 67% majority in Congress does not care, and they won't in the near future, which leaves Corporations to do as they please -- maximize their profits rather than employment.
The Joss Whedon script for Serenity, where Wash lives, is Serenity-190pages.pdf at www.mediafire.com/folder/1uwh75oa407q8/Firefly
I know you're shilling for the Democrats again, but they come with way too much other baggage for anyone to vote them in.
I suggest they start taking a much more moderate approach to a host of other issues if they ever want to see a supermajority again.
Do Right, Be Right. :)
NOTIFY: Y | REPLY | REPLY WITH QUOTE | PERMALINK | TOP | HOME
Quote:The feverish SpinDoctoring that second insists upon doing for Obamanomics is impressive.
Originally posted by second:Quote:Arguing pro or con about the accuracy of the Bureau of Labor Statistics does you no good, but why should it? The BLS serves the Feds and political parties, not you.
Originally posted by 6IXSTRINGJACK:
Why do I have to repeat anything? I'm not arguing with you.
Nothing in my post was arguing your point and actually augments your own argument.
Looking at the BLS numbers, the Feds could decide to beat the Corporations into submission so that one of them will hire you at a good wage. Or the Feds can decide to do nothing useful. Depends on who controls Congress and by the word "control" I mean 67% majority, not a measly 51%. In the range between 66% and 50%, things tend to not change for the better because of the rules of Congress, but rather devolve into chaos. At 67%, things can change fast. (See for example: WWII where more than 67% of Congress was willing to do whatever it takes to win. The Ford Corp, as one example, hated that the Feds bullied it to make B-24 bombers and hire more workers. Henry Ford refused on principle to hire women. He was bitter. He was forced to resign because he was standing in the way of what the Feds wanted.)
Whether you believe that fast change in the future is for the better or worse depends on which party you prefer. It does not matter what the BLS unemployment numbers are. Those are just for Congress and the President. If they want to do something about unemployment, then Congress and the President could use force on the Corporations. But a 67% majority in Congress does not care, and they won't in the near future, which leaves Corporations to do as they please -- maximize their profits rather than employment.
Any reasonable person in 2006 and 2008 knew Democraps and Obama would wreck the Economy, and when the facts threatened to reveal this truth, Obama endeavored to cover-up the facts, redefine the numbers to reflect his preferred lies. This is where 6ix starts his complaint. That Obamanomics worked so hard to ship all of our jobs overseas is glossed over. Just ignore the Obamanomics worst performance in history. Never you mind Obamanomics creating more unemployed than FDR's Great Depression. Don't pay any attention to real Democrap failures being accurately reported. Just ignore reality.
So the Libtard solution to their failures being exposed? Give them MORE CONTROL over the Economy, eliminate Free Market, eliminate Free Enterprise, return to Communism. You just don't understand that you didn't give them ENOUGH control when they were Hell-bent on destroying America. Their model is when the Isolationist FDR & Democraps grew the Axis too large, they were able to take Government control of private companies to enforce their Socialist Utopias.
After The Unions forced our jobs overseas, it is difficult to reverse. Trump has done some, but Unions insist upon sending more overseas, and replacing as many as possible with automation.
NOTIFY: Y | REPLY | REPLY WITH QUOTE | PERMALINK | TOP | HOME
Quote:6ix, if your data is actually as real as you claim, please convert these Libtard Maths into something non-Libtards can understand.
Originally posted by JEWELSTAITEFAN:
That U-6 data is hidden pretty well. I added the data to my earlier post. Found it in Table A-15 after 2010.
Your table is littered with Libtard BS.
Stock Market Crash in March 2000? Do you believe that?
And 3.8 is the lowest differential, while the prior 2 years are 3.1% - Libtard Maths at work.
And 9.9% us as low as 8.4% - more Libtard Maths at work. Sheesh.
Merely linking to a Libtard source does not bolster your claims.
NOTIFY: Y | REPLY | REPLY WITH QUOTE | PERMALINK | TOP | HOME
I don't see how it's Libtard.
They're saying that the numbers were bullshit under Obama as well.
Do Right, Be Right. :)
NOTIFY: Y | REPLY | REPLY WITH QUOTE | PERMALINK | TOP | HOME
Quote:JewelStaiteFan, I'm in the top 1% and you aren't anything more than ignorant nut on how Corporations work. Flexible work arrangements, which include crowdsourcing platforms such as Uber, as well as freelancers and independent contractors, increased about 50 percent from 2005 to 2015. These jobs account for 94 percent — nearly all — of the net employment growth in the United States over that time. Neither JewelStaiteFan, 6ixStringJack, nor the GOP know how to stop Corporations from screwing over their workers. If you knew how, you wouldn't dare use your knowledge because you would have to kick many very rich people in the balls to make them behave generously toward Americans in the lower half of the economy. The rich won't voluntarily treat their employees better. It feels unnatural, even crazy to the rich, paying more than the least amount in wages. That's my experience.
Originally posted by JEWELSTAITEFAN:
The feverish SpinDoctoring that second insists upon doing for Obamanomics is impressive.
Any reasonable person in 2006 and 2008 knew Democraps and Obama would wreck the Economy, and when the facts threatened to reveal this truth, Obama endeavored to cover-up the facts, redefine the numbers to reflect his preferred lies. This is where 6ix starts his complaint. That Obamanomics worked so hard to ship all of our jobs overseas is glossed over.
So the Libtard solution to their failures being exposed? Give them MORE CONTROL over the Economy, eliminate Free Market, eliminate Free Enterprise, return to Communism. You just don't understand that you didn't give them ENOUGH control when they were Hell-bent on destroying America. Their model is when the Isolationist FDR & Democraps grew the Axis too large, they were able to take Government control of private companies to enforce their Socialist Utopias.
After The Unions forced our jobs overseas, it is difficult to reverse. Trump has done some, but Unions insist upon sending more overseas, and replacing as many as possible with automation.
www.theatlantic.com/business/archive/2018/04/walmarts-future-workforce
-robots-and-freelancers/557063/
The Joss Whedon script for Serenity, where Wash lives, is Serenity-190pages.pdf at www.mediafire.com/folder/1uwh75oa407q8/Firefly
NOTIFY: Y | REPLY | REPLY WITH QUOTE | PERMALINK | TOP | HOME
Quote:
Originally posted by second:
I'm in the top 1%
No you're not.
Do Right, Be Right. :)
NOTIFY: Y | REPLY | REPLY WITH QUOTE | PERMALINK | TOP | HOME
Quote:1. Explain the Fake News Story that the Stock Market Crashed in March 2000.
Originally posted by 6IXSTRINGJACK:
I don't see how it's Libtard.
They're saying that the numbers were bullshit under Obama as well.
Do Right, Be Right. :)
2. Explain how "U3 closest to U6" at 3.8 in 2002 is closer than 3.1 in 2001, and closer than 3.1 in 2000.
3. Explain how 2016 (Obama) has returned to pre-recession levels with U3 of 4.9% and U6 of 9.9%, while the onset of The Rock-the-Vote Recession was February 2008, and these numbers are worse than every non-Recession year 2007, 2006, 2005 since the last Recession - and not as good as 2008 Recession year.
4. Explain how your number for 2018 U6 is 8.2% while BLS reported 8.9%. BLS is the Definer of U6, and the sole provider of that number - so why are you claiming a number which does not match?
NOTIFY: Y | REPLY | REPLY WITH QUOTE | PERMALINK | TOP | HOME
Quote:
Originally posted by JEWELSTAITEFAN:
1. Explain the Fake News Story that the Stock Market Crashed in March 2000.
Not fake news.
The Dotcom Crash - March 11, 2000 to October 9, 2002
The Nasdaq Composite lost 78% of its value as it fell from 5046.86 to 1114.11.
https://www.investopedia.com/features/crashes/crashes8.asp
Quote:
2. 2. Explain how "U3 closest to U6" at 3.8 in 2002 is closer than 3.1 in 2001, and closer than 3.1 in 2000.
I don't understand the question. What is 3.8 and what is 3.1 and 3.1?
I'll get back to you on the rest later. Meanwhile, you're going to have to find a link for your numbers. I'm having a hard time finding a yearly average of numbers since they seem to be broken down by months. Either you or the article I linked might just be taking a number from the month during the year to best suit your particular arguments.
Do Right, Be Right. :)
NOTIFY: Y | REPLY | REPLY WITH QUOTE | PERMALINK | TOP | HOME
Quote:I forgot you can't do math.
Originally posted by 6IXSTRINGJACK:Quote:Not fake news.
Originally posted by JEWELSTAITEFAN:
1. Explain the Fake News Story that the Stock Market Crashed in March 2000.
The Dotcom Crash - March 11, 2000 to October 9, 2002
The Nasdaq Composite lost 78% of its value as it fell from 5046.86 to 1114.11.
https://www.investopedia.com/features/crashes/crashes8.aspQuote:I don't understand the question. What is 3.8 and what is 3.1 and 3.1?
2. 2. Explain how "U3 closest to U6" at 3.8 in 2002 is closer than 3.1 in 2001, and closer than 3.1 in 2000.
I'll get back to you on the rest later. Meanwhile, you're going to have to find a link for your numbers. I'm having a hard time finding a yearly average of numbers since they seem to be broken down by months. Either you or the article I linked might just be taking a number from the month during the year to best suit your particular arguments.
Do Right, Be Right. :)
9.5 - 5.7 = 3.8 your quoted claim of the closest U3 and U6 got in 2002.
7.3 - 4.2 = 3.1 the year prior.
7.1 - 4.0 = 3.1 the year before that.
NOTIFY: Y | REPLY | REPLY WITH QUOTE | PERMALINK | TOP | HOME
Quote:Holy Cow, you must be a genius!!!
Originally posted by 6IXSTRINGJACK:Quote:Not fake news.
Originally posted by JEWELSTAITEFAN:
1. Explain the Fake News Story that the Stock Market Crashed in March 2000.
The Dotcom Crash - March 11, 2000 to October 9, 2002
The Nasdaq Composite lost 78% of its value as it fell from 5046.86 to 1114.11.
https://www.investopedia.com/features/crashes/crashes8.asp
Do Right, Be Right. :)
A specialized subpart of a corner of The Stock Market has a decline over 30 months so IT MUST BE A CRASH!!!
From Jan 2000 at 11,700 Dow until May 2001 with a couple hundred less Dow, that is just crystal clarity in focusing your laser sharp identification of massive drops in STOCK MARKET VALUE. Dropping a whole couple percent in only a span of 16 months, that is such a total CRASH, totally fer sure.
By this standard of measurement, the huge CRASH from July 1997 to October 2002 resulted in the drop from 8,038 down to a whopping 7,286 in only a period of 63 months, a loss of almost 10%, or almost 1% per 9 months.
I'm really disappointed you believe such pablum.
A decrease from May 2001 to October 2002 of 4,100 DOW? That's a drop of 36% in 17 months, or over 2% per month average of the Broader Market, so probably doesn't suit your definition of a Crash.
In MArch 2000 it looks like Dow was under 10,000. So then it gained about 1,600 by May 2001. With a gain of about 16% from the onset of your defined CRASH, that much gain indicates such a horrible crash, everybody must have known about it!! But the News of the time did not report this 16% growth as a crash.
NOTIFY: Y | REPLY | REPLY WITH QUOTE | PERMALINK | TOP | HOME
I don't know who you're talking to, son, but I can math far better than you.
You don't seem to do English to gud though. If you're going to ask somebody questions, make sure the questions you're asking make sense.
Don't downplay the Nasdaq. 78% is a huge loss, and since we're talking a crash in tech that's where the biggest numbers in the drop would have occured. The dotcom crash was a thing. You will find 100% bipartisan agreement about it being a thing. It was a very big thing, and although it was not GWB's fault it did start off his presidency poorly. It also coincided with the first time we saw $2 per gallon of gasoline. A ton of jobs were lost, and mine was one of them at the time.
Consider yourself lucky that you managed to dodge two bullets if you've remained employed this entire time.
Now that you've gone back and re-articulated yourself, I'll eventually get to answering your questions when I have some time.
Do Right, Be Right. :)
NOTIFY: Y | REPLY | REPLY WITH QUOTE | PERMALINK | TOP | HOME
Oh.... and BTW....
The DOW was at 17,004 in December of 1999.
By September of 2002, it had dropped from 17,004 to 10,446. This was a drop of 39% in the same time frame that the NASDAQ dropped by 78%.
The DOW would not see 17,000 again for 14 years until November of 2013.
The only way that you could deny that this was a market crash is if you're suffering form Conservitard delusions of your own.
http://www.macrotrends.net/1319/dow-jones-100-year-historical-chart
More later...
Do Right, Be Right. :)
NOTIFY: Y | REPLY | REPLY WITH QUOTE | PERMALINK | TOP | HOME
Quote:no.
Originally posted by 6IXSTRINGJACK:
Oh.... and BTW....
The DOW was at 17,004 in December of 1999.
Quote:no.
By September of 2002, it had dropped from 17,004 to 10,446.
Quote:14 years? No.
This was a drop of 39% in the same time frame that the NASDAQ dropped by 78%.
The DOW would not see 17,000 again for 14 years until November of 2013.
Quote:GWB was not President in 2000, let alone March.
The only way that you could deny that this was a market crash is if you're suffering form Conservitard delusions of your own.
http://www.macrotrends.net/1319/dow-jones-100-year-historical-chart
More later...
Do Right, Be Right. :)
NOTIFY: Y | REPLY | REPLY WITH QUOTE | PERMALINK | TOP | HOME
Quote:
Originally posted by JEWELSTAITEFAN:
no.
Quote:
no.
Quote:
No.
Upon further investigation, I couldn't get the same numbers anywhere. I was about to email the site that I linked and call them lying bastards, until I realized that they have a checkbox for "adjust for inflation" automatically checked.
WTF? Why would they do that? Who talks about the DOW with inflation?
Quote:
GWB was not President in 2000, let alone March.
Correct. My mistake.
Using the same website, without the gorram box for inflation checked, the DOW was at 11,497 in December of 1999. By October of 2002, it had bottomed out at 7,591.
That is still a loss of 34% of the value of the entire DJIA during the same time frame that the NASDAQ took a loss of 78%.
Still a Market crash, no matter which way you look at it.
The DJIA did not see those numbers again for nearly 7 years in September of 2006 when it reached 11,679. And the further gains and good times only lasted about a year and a half, when in May of 2008 it started free falling again until finally landing even lower to 7,062 in February of 2009 in the aftermath of the housing bubble bursting.
So. Question 1 answered. Are you still denying there was a market crash that began in 2000?
Do Right, Be Right. :)
NOTIFY: Y | REPLY | REPLY WITH QUOTE | PERMALINK | TOP | HOME
Quote:One reason they want to use "adjusted" figures is so they can float different numbers every day, based upon backwards adjustment of each different day you try to obtain the numbers. This makes it impossible to nail down their lies, because the "historical" numbers change every day.
Originally posted by 6IXSTRINGJACK:Quote:
Originally posted by JEWELSTAITEFAN:
no.Quote:
no.Quote:
No.
Upon further investigation, I couldn't get the same numbers anywhere. I was about to email the site that I linked and call them lying bastards, until I realized that they have a checkbox for "adjust for inflation" automatically checked.
WTF? Why would they do that? Who talks about the DOW with inflation?Quote:
GWB was not President in 2000, let alone March.
Correct. My mistake.
Do Right, Be Right. :)
The same applies to "adjusting" the figures like BLS does. They work tirelessly to gloss over the actual figures in order to obfuscate how bad Obamanomics was. Did you read this month's summary? A although the real numbers are the best we've had in decades, they are proclaiming No Change, No Difference, Little Change, No Significant Difference, move along now, ignore these numbers, these are not the figures you are looking for.
Another observation: this month shows that the Want A Job category plus the Involuntary Part-Time category totals less than 10 million, for the first and only time on my table. I could not find accurate data from before January 2008.
NOTIFY: Y | REPLY | REPLY WITH QUOTE | PERMALINK | TOP | HOME
Reposting for top of the page reference:
Updated with today's report:
Quote:
Originally posted by JEWELSTAITEFAN:
BLS currently defines the Want A Job category as not being part of the Labor Force.
So I will post some actual numbers and let the comparisons and discussion follow. The documented shenanigans of Obamabots deliberately refusing to Report jobless data in the months before the 2012 Election are a different matter, I will just use the Fake Data they produced and pretend it was real.
I will use only the Unadjusted numbers, to help maintain clarity and transparency.
Mo/Yr Unemp Pcnt WAJb Pcnt SubTtl Prcnt InvPT Pcnt Total Percnt CivPop LbrForc Prtc% U-6%
Jan08 08221 05.4% 4977 3.2% 13198 08.6% 5235 3.5% 18433 12.1% 232616 152828 65.7 09.9
Jan09 13009 08.5% 5866 3.8% 18875 12.3% 8675 5.7% 27550 18.0% 234739 153445 65.4 15.4
Jan10 16147 10.6% 6108 4.0% 22255 14.6% 9161 5.9% 31416 20.5% 236832 152957 64.6 18.0
Jan11 14937 09.8% 6643 4.3% 21580 14.1% 9027 6.0% 30607 20.1% 238704 152536 63.9 17.3
Jan12 13541 08.8% 6495 4.3% 20036 13.1% 8747 5.7% 28783 18.8% 242269 153485 63.4 16.2
Jan13 13181 08.5% 6781 4.4% 19962 12.9% 8506 5.5% 28468 18.4% 244663 154794 63.3 15.4
Jan14 10855 07.0% 6508 4.2% 17363 11.2% 7617 5.0% 24980 16.2% 246915 154381 62.5 13.5
Jan15 09498 06.1% 6467 4.1% 15965 10.2% 7125 4.6% 23090 14.8% 249723 156050 62.5 12.0
Jan16 08309 05.3% 6166 3.9% 14475 09.2% 6234 4.0% 20709 13.2% 252397 157347 62.3 10.5
Jan17 08149 05.1% 5934 3.8% 14083 08.9% 6127 3.8% 20210 12.7% 254082 158676 62.5 10.1
Jan18 07189 04.5% 5364 3.3% 12553 07.8% 5380 3.4% 17933 11.2% 256780 160037 62.3 08.9
Feb18 07091 04.4% 5152 3.2% 12243 07.6% 5241 3.2% 17484 10.8% 256934 161494 62.9 08.6
Mar18 06671 04.1% 4793 3.0% 11464 07.1% 4975 3.1% 16439 10.2% 257097 161548 62.8 08.1
Jul 12 13400 08.6% 6837 4.3% 20237 12.9% 8218 5.3% 28455 18.2% 243354 156526 64.3 15.2
Aug12 12696 08.2% 7631 4.9% 20327 13.1% 7723 5.0% 28050 18.1% 243566 155255 63.7 14.6
Sep12 11742 07.6% 6427 4.1% 18169 11.7% 8003 5.2% 26172 16.9% 243772 155075 63.6 14.2
Oct12 11741 07.5% 6142 4.0% 17883 11.5% 7768 5.0% 25651 16.5% 243983 155779 63.8 13.9
Nov12 11404 07.4% 6495 4.2% 17899 11.6% 7898 5.0% 25797 16.6% 244174 154953 63.5 13.9
Quote:
The Civilian Adult Population steadily Increases, suggesting that figure is not manipulated.
The Unemployment Rate after 2008 was able to be artificially less by shifting more unemployed into the Want A Job category, which Obamanomics managed to increase to over 7 Million for the only time in the BLS tables. This Jan figure (Want A Job) didn't return to within 0.1% of 2008 level until 2018, after Trump's first year.
The figure of Unemployed plus Want A Job is indisputably the real Unfake Unemployment figure.
The Labor Force Participation Rate steadily dropped each year until finally reversing in 2017, Trump's first year.
The Want A Job count maxxed out in Aug 2012, just as Obama was proclaiming that Unemployment Rates had dropped, which he needed to get below 8.0% by October, in order to win re-election.
NOTIFY: Y | REPLY | REPLY WITH QUOTE | PERMALINK | TOP | HOME
Quote:
Originally posted by JEWELSTAITEFAN:
One reason they want to use "adjusted" figures is so they can float different numbers every day, based upon backwards adjustment of each different day you try to obtain the numbers. This makes it impossible to nail down their lies, because the "historical" numbers change every day.
I don't doubt this at all. It's unfortunate that they do this though since the interactive graph on that site is better than any that I've found anywhere else in terms of the ease of use and how the information is presented.
It's a good thing I noticed that you can uncheck the "Lie To Me" option they set to default. Thanks for making me check my facts.
Quote:
The same applies to "adjusting" the figures like BLS does. They work tirelessly to gloss over the actual figures in order to obfuscate how bad Obamanomics was. Did you read this month's summary? A although the real numbers are the best we've had in decades, they are proclaiming No Change, No Difference, Little Change, No Significant Difference, move along now, ignore these numbers, these are not the figures you are looking for.
There's no doubt the DOW is doing better than it ever has, or pretty close to the high today at least. I still don't think that translates at all to helping the average working class family in the least bit though.
In case you didn't notice it, I re-stated the case after unchecking the websites "Lie To Me" option. The DOW still lost 34% from December of 1999 to October of 2002. The same time frame that the NASDAQ lost 78% of its value.
Do Right, Be Right. :)
NOTIFY: Y | REPLY | REPLY WITH QUOTE | PERMALINK | TOP | HOME
Quote:Here is your newly altered post.
Originally posted by 6IXSTRINGJACK:Quote:
Originally posted by JEWELSTAITEFAN:
no.Quote:
no.Quote:Upon further investigation, I couldn't get the same numbers anywhere. I was about to email the site that I linked and call them lying bastards, until I realized that they have a checkbox for "adjust for inflation" automatically checked.
No.
WTF? Why would they do that? Who talks about the DOW with inflation?Quote:Correct. My mistake.
GWB was not President in 2000, let alone March.
Using the same website, without the gorram box for inflation checked, the DOW was at 11,497 in December of 1999. By October of 2002, it had bottomed out at 7,591.
That is still a loss of 34% of the value of the entire DJIA during the same time frame that the NASDAQ took a loss of 78%.
Still a Market crash, no matter which way you look at it.
The DJIA did not see those numbers again for nearly 7 years in September of 2006 when it reached 11,679. And the further gains and good times only lasted about a year and a half, when in May of 2008 it started free falling again until finally landing even lower to 7,062 in February of 2009 in the aftermath of the housing bubble bursting.
So. Question 1 answered. Are you still denying there was a market crash that began in 2000?
Do Right, Be Right. :)
From Dec 1999 until May 2001 the DOW dropped 100 points, right? And you are claiming that this drop of less than 1% over the span of 18 months is a crash, or part of your crash, right?
Yes, I most certainly dispute that a change of 1% in the DOW is a crash, of any sort, using any reasonable definition.
If you correct your claim to state that a crash of 34% started in May 2001, then people could see that you have swerved into reality.
Instead of Feb 2009, you might check 9 March 2009.
Using your flimsy definition of "crash" the crash that ended in early 2009 started in July 1997 - it doesn't matter how high the DOW got in between those dates according to your definition.
Sector crashes happen all the time. Currently the FANG sector is in what some call a crash.
The broader Market indices of DJIA and S&P 500 did not have a crash starting in 2000, so it is no problem for me or anybody to deny what did not happen. Both of these did start a crash in 2001.
Crashes of Russell 2000, IEFE, NASDAQ, Wilshire 5000, or any other subsector indices do not define a Stock Market Crash. Many times these falter while the Bull Market roars onward and upward.
When the Market Crashed in 2001, few if any sectors withstood the environment without dropping also, so it is no surprise that a sector did not gain during an actual Market Crash.
NOTIFY: Y | REPLY | REPLY WITH QUOTE | PERMALINK | TOP | HOME
Quote:
Originally posted by JEWELSTAITEFAN:
From Dec 1999 until May 2001 the DOW dropped 100 points, right?
No. It lost over 550 points in between those dates.
Quote:
And you are claiming that this drop of less than 1% over the span of 18 months is a crash, or part of your crash, right?
Part of the original website's crash, which was referencing the steep decline of the NASDAQ that early as a precursor to what would happen to the DOW.
Quote:
Yes, I most certainly dispute that a change of 1% in the DOW is a crash, of any sort, using any reasonable definition.
Okay. Then look between May of 2001 (10,911) to September of 2002 (7,591) instead. That's still a loss of 31% of the DOW in even less time. It also puts it completely under GWB's watch.
During that time, the NASDAQ went from 2,956 (May 2001) to 1,612 (Sept 2002). That's a drop of 45%.
Not the 78% drop that was figured in the original link using the original dates that primarily effected the NASDAQ, but these numbers of 31% and 45% are a lot closer. (And they don't include the original 33% drop in the NASDAQ before we begin counting with our new date of May of 2001).
If anything, this is evidence that the earlier beginnings of the total 78% crash of the NASDAQ brought about the 31% crash of the DOW a year later.
Not really anything we didn't already know. The dotcom bubble bursting was terrible for the economy, and it was followed by the beginning of the never-ending wars we still find ourselves mired in today.
Just curious, now that this is all cleared up. Are you denying that a 31% loss in a year is a crash?
Do Right, Be Right. :)
NOTIFY: Y | REPLY | REPLY WITH QUOTE | PERMALINK | TOP | HOME
Quote:You Stated Dow was at 11,497 in Dec 1999. Dow was at about 11,400 in May 2001. For most people, simple subtraction reveals the difference of about 100.
Originally posted by 6IXSTRINGJACK:Quote:No. It lost over 550 points in between those dates.
Originally posted by JEWELSTAITEFAN:
From Dec 1999 until May 2001 the DOW dropped 100 points, right?
Get back to us when you've corrected your Maths.
Quote:Welcome to reality. Nice of you to visit.Quote:Part of the original website's crash, which was referencing the steep decline of the NASDAQ that early as a precursor to what would happen to the DOW.
And you are claiming that this drop of less than 1% over the span of 18 months is a crash, or part of your crash, right?Quote:Okay. Then look between May of 2001 (10,911) to September of 2002 (7,591) instead. That's still a loss of 31% of the DOW in even less time.
Yes, I most certainly dispute that a change of 1% in the DOW is a crash, of any sort, using any reasonable definition.
Quote:Again, welcome to reality.
During that time, the NASDAQ went from 2,956 (May 2001) to 1,612 (Sept 2002). That's a drop of 45%.
Quote:All of the Real World understood that a Market Crash started in 2001.
Not the 78% drop that was figured in the original link using the original dates that primarily effected the NASDAQ, but these numbers of 31% and 45% are a lot closer. (And they don't include the original 33% drop in the NASDAQ before we begin counting with our new date of May of 2001).
If anything, this is evidence that the earlier beginnings of the total 78% crash of the NASDAQ brought about the 31% crash of the DOW a year later.
Not really anything we didn't already know. The dotcom bubble bursting was terrible for the economy, and it was followed by the beginning of the never-ending wars we still find ourselves mired in today.
Just curious, now that this is all cleared up. Are you denying that a 31% loss in a year is a crash?
Do Right, Be Right. :)
You were arguing that a drop of 1% from early 2000 to mid 2001 was a crash, which few would really believe.
Everybody knows a crash started in 2001.
Claiming that a Stock Market Crash occurred in March 2000 is pure hocum.
NOTIFY: Y | REPLY | REPLY WITH QUOTE | PERMALINK | TOP | HOME
Quote:
Originally posted by JEWELSTAITEFAN:
You Stated Dow was at 11,497 in Dec 1999. Dow was at about 11,400 in May 2001. For most people, simple subtraction reveals the difference of about 100.
Dow was 10,991 in May of 2001. 500+ point difference.
I'm sure it bounced around from day to day, but I'm getting all of these figures from this particular graph.
Quote:
Get back to us when you've corrected your Maths.
My maths be fine.
Quote:
All of the Real World understood that a Market Crash started in 2001.
You were arguing that a drop of 1% from early 2000 to mid 2001 was a crash, which few would really believe.
Everybody knows a crash started in 2001.
Claiming that a Stock Market Crash occurred in March 2000 is pure hocum.
No it's not. The NASDAQ did take a huge dive when the article said it did. The tech bubble bursting is what started the market crash. Just because it didn't show in the DOW until later didn't mean that it didn't begin earlier during the first year when the NASDAQ initially plummeted over 30% before it started effecting the DOW overall, and finally bottomed out after losing 78% when both indexes hit their lows for the time.
I don't even understand why you're being so obtuse about the issue.
All you've done here is moved the timeline forward so that it all happened while GWB was in office, rather than it's true beginnings at the end of the Clinton Administration.
Aren't you arguing against your Conserveitard principals here?
I'm trying to help you out here, buddy.
Do Right, Be Right. :)
NOTIFY: Y | REPLY | REPLY WITH QUOTE | PERMALINK | TOP | HOME
If your source isn't giving you adequate information, then it is crap.
Try looking up "historical DJIA prices"
Looks like Dow may have been around 10,991 on 1 May 2001, or 30 May. 15, 16, 17, 18, 19, 20 May 2001 was 11,400.
An almost 4% change in a couple weeks is not often ignored by serious investors, and you shouldn't either.
A 1% drop is not a crash, whether in a day or in 18 months, like you are claiming.
Making up stories, lying, rewriting history doesn't serve anybody except liars.
Denying history is the domain of Libtards.
First clearly identify history, then analyze why. Don't lie about history just to support your bias.
NOTIFY: Y | REPLY | REPLY WITH QUOTE | PERMALINK | TOP | HOME
Quote:
Originally posted by JEWELSTAITEFAN:
If your source isn't giving you adequate information, then it is crap.
Try looking up "historical DJIA prices"
I'm fine with the numbers. I gave you the source that we're getting them from. Oddly, you're fine with the first one, but take issue with the second one.
Quote:
Looks like Dow may have been around 10,991 on 1 May 2001, or 30 May. 15, 16, 17, 18, 19, 20 May 2001 was 11,400.
So. Then we're agreed that at some date in May of 2001 it was 10,991. Who cares what date it was? I'm assuming that every number on any graph is from a certain date.
I'd love to see a graph that showed the average for the month, for every month, going back at least as far as the 90's. I haven't found one. If you do, let me know.
Quote:
An almost 4% change in a couple weeks is not often ignored by serious investors, and you shouldn't either.
Maybe not, but you're ignoring it right now. Because it suits you, you're going with data that gives a 1% drop from a different website or graph that you haven't linked. I'm going with whatever number they put for the month on this graph. I seriously doubt that the creators of this graph put it together with numbers that would make your argument look bad on this particular forum. Geez.
Quote:
A 1% drop is not a crash, whether in a day or in 18 months, like you are claiming.
I'm not claiming it is.
Quote:
Making up stories, lying, rewriting history doesn't serve anybody except liars.
Denying history is the domain of Libtards.
First clearly identify history, then analyze why. Don't lie about history just to support your bias.
I've given a link with numbers. You've given nothing.
Your'e the one that's lying right now. And I have no idea why. The difference between 1% and 4% is moot.
What is important is while the DOW lost 1% to 4%, the NASDAQ lost over 30%, then the DOW lost well over 30% as the NASDAQ lost another 40+%.
Do Right, Be Right. :)
NOTIFY: Y | REPLY | REPLY WITH QUOTE | PERMALINK | TOP | HOME
Quote:
Originally posted by JEWELSTAITEFAN:
Don't lie about history just to support your bias.
I thought about this more, and frankly I want to know what you think my bias is here.
You're hung up on this little detail that has gone so far off the original topic that I just don't get it.
Honestly, I'll say that I don't even know why I'm arguing you at this point other than the fact that you're being insulting every time you post.
We seem to have wandered pretty far off the map.
Do Right, Be Right. :)
NOTIFY: Y | REPLY | REPLY WITH QUOTE | PERMALINK | TOP | HOME
Quote:This was meant in generic terms, a general rule of thumb.
Originally posted by 6IXSTRINGJACK:Quote:I thought about this more, and frankly I want to know what you think my bias is here.
Originally posted by JEWELSTAITEFAN:
Don't lie about history just to support your bias.
You're hung up on this little detail that has gone so far off the original topic that I just don't get it.
Honestly, I'll say that I don't even know why I'm arguing you at this point other than the fact that you're being insulting every time you post.
We seem to have wandered pretty far off the map.
Do Right, Be Right. :)
Whatever your bias, or anybody's bias, rewriting history to backstop a delusion, or fabricating evidence to support a spin, does not serve the logical argument.
Look at the evidence first, then draw conclusions. Do not create conclusions first and then search for errant wisps of evidence to support them.
I had already moved on, you weren't getting anywhere. I only replied to this due to your direct question.
NOTIFY: Y | REPLY | REPLY WITH QUOTE | PERMALINK | TOP | HOME
Quote:
Originally posted by JEWELSTAITEFAN:
This was meant in generic terms, a general rule of thumb.
Whatever your bias, or anybody's bias, rewriting history to backstop a delusion, or fabricating evidence to support a spin, does not serve the logical argument.
Look at the evidence first, then draw conclusions. Do not create conclusions first and then search for errant wisps of evidence to support them.
I had already moved on, you weren't getting anywhere. I only replied to this due to your direct question.
Bullshit. You didn't move anywhere. You're hung up on a single line of a table that doesn't do anything to bolster either of our arguments either way.
The only thing that line decides is the beginning of the market crash and what somebody would perceive as it's beginning.
I happen to agree 100% with the source that the NASDAQ falling over 30% signaled the beginning of the crash, since the crash was tech based. You don't agree with that.
Big fucking deal.
There's no "bias".
I've already asked you what you think my bias is here, and you won't answer that question. Why is that?
The link that you're so hung up over that single line in the table doesn't go out of its way to make the Right look bad, as far as I can tell. It seems to be fair and actually put the worst of times during Democratic Administrations. So what gives?
Do Right, Be Right. :)
NOTIFY: Y | REPLY | REPLY WITH QUOTE | PERMALINK | TOP | HOME
And splitting the table into 2 smaller versions:
I will refer to this set of data as Table JSF-URF-1AB
Updated with today's report:
Quote:
Originally posted by JEWELSTAITEFAN:
BLS currently defines the Want A Job category as not being part of the Labor Force.
So I will post some actual numbers and let the comparisons and discussion follow. The documented shenanigans of Obamabots deliberately refusing to Report jobless data in the months before the 2012 Election are a different matter, I will just use the Fake Data they produced and pretend it was real.
I will use only the Unadjusted numbers, to help maintain clarity and transparency.
Mo/Yr Unemp Pcnt WAJb Pcnt SubTtl Prcnt InvPT Pcnt Total Percnt
Jan08 08221 05.4% 4977 3.2% 13198 08.6% 5235 3.5% 18433 12.1%
Jan09 13009 08.5% 5866 3.8% 18875 12.3% 8675 5.7% 27550 18.0%
Jan10 16147 10.6% 6108 4.0% 22255 14.6% 9161 5.9% 31416 20.5%
Jan11 14937 09.8% 6643 4.3% 21580 14.1% 9027 6.0% 30607 20.1%
Jan12 13541 08.8% 6495 4.3% 20036 13.1% 8747 5.7% 28783 18.8%
Jan13 13181 08.5% 6781 4.4% 19962 12.9% 8506 5.5% 28468 18.4%
Jan14 10855 07.0% 6508 4.2% 17363 11.2% 7617 5.0% 24980 16.2%
Jan15 09498 06.1% 6467 4.1% 15965 10.2% 7125 4.6% 23090 14.8%
Jan16 08309 05.3% 6166 3.9% 14475 09.2% 6234 4.0% 20709 13.2%
Jan17 08149 05.1% 5934 3.8% 14083 08.9% 6127 3.8% 20210 12.7%
Jan18 07189 04.5% 5364 3.3% 12553 07.8% 5380 3.4% 17933 11.2%
Feb18 07091 04.4% 5152 3.2% 12243 07.6% 5241 3.2% 17484 10.8%
Mar18 06671 04.1% 4793 3.0% 11464 07.1% 4975 3.1% 16439 10.2%
Jul 12 13400 08.6% 6837 4.3% 20237 12.9% 8218 5.3% 28455 18.2%
Aug12 12696 08.2% 7631 4.9% 20327 13.1% 7723 5.0% 28050 18.1%
Sep12 11742 07.6% 6427 4.1% 18169 11.7% 8003 5.2% 26172 16.9%
Oct12 11741 07.5% 6142 4.0% 17883 11.5% 7768 5.0% 25651 16.5%
Nov12 11404 07.4% 6495 4.2% 17899 11.6% 7898 5.0% 25797 16.6%
Mo/Yr Unemp Pcnt WAJb Pcnt Total Percnt CivPop LbrForc Prtc% U-6%
Jan08 08221 05.4% 4977 3.2% 18433 12.1% 232616 152828 65.7 09.9
Jan09 13009 08.5% 5866 3.8% 27550 18.0% 234739 153445 65.4 15.4
Jan10 16147 10.6% 6108 4.0% 31416 20.5% 236832 152957 64.6 18.0
Jan11 14937 09.8% 6643 4.3% 30607 20.1% 238704 152536 63.9 17.3
Jan12 13541 08.8% 6495 4.3% 28783 18.8% 242269 153485 63.4 16.2
Jan13 13181 08.5% 6781 4.4% 28468 18.4% 244663 154794 63.3 15.4
Jan14 10855 07.0% 6508 4.2% 24980 16.2% 246915 154381 62.5 13.5
Jan15 09498 06.1% 6467 4.1% 23090 14.8% 249723 156050 62.5 12.0
Jan16 08309 05.3% 6166 3.9% 20709 13.2% 252397 157347 62.3 10.5
Jan17 08149 05.1% 5934 3.8% 20210 12.7% 254082 158676 62.5 10.1
Jan18 07189 04.5% 5364 3.3% 17933 11.2% 256780 160037 62.3 08.9
Feb18 07091 04.4% 5152 3.2% 17484 10.8% 256934 161494 62.9 08.6
Mar18 06671 04.1% 4793 3.0% 16439 10.2% 257097 161548 62.8 08.1
Jul 12 13400 08.6% 6837 4.3% 28455 18.2% 243354 156526 64.3 15.2
Aug12 12696 08.2% 7631 4.9% 28050 18.1% 243566 155255 63.7 14.6
Sep12 11742 07.6% 6427 4.1% 26172 16.9% 243772 155075 63.6 14.2
Oct12 11741 07.5% 6142 4.0% 25651 16.5% 243983 155779 63.8 13.9
Nov12 11404 07.4% 6495 4.2% 25797 16.6% 244174 154953 63.5 13.9
Quote:
The Civilian Adult Population steadily Increases, suggesting that figure is not manipulated.
The Unemployment Rate after 2008 was able to be artificially less by shifting more unemployed into the Want A Job category, which Obamanomics managed to increase to over 7 Million for the only time in the BLS tables. This Jan figure (Want A Job) didn't return to within 0.1% of 2008 level until 2018, after Trump's first year.
The figure of Unemployed plus Want A Job is indisputably the real Unfake Unemployment figure.
The Labor Force Participation Rate steadily dropped each year until finally reversing in 2017, Trump's first year.
The Want A Job count maxxed out in Aug 2012, just as Obama was proclaiming that Unemployment Rates had dropped, which he needed to get below 8.0% by October, in order to win re-election.
Well, gee whiz. The default font must still be different from one compute
NOTIFY: Y | REPLY | REPLY WITH QUOTE | PERMALINK | TOP | HOME
It's not readable here. You should probably link the source table, or create a google spreadsheet with the data.
Do Right, Be Right. :)
NOTIFY: Y | REPLY | REPLY WITH QUOTE | PERMALINK | TOP | HOME
Quote:Sure.
Originally posted by 6IXSTRINGJACK:
It's not readable here. You should probably link the source table, or create a google spreadsheet with the data.
Do Right, Be Right. :)
You find a source with all the relevent data, or create your spreadsheet, and then post it.
NOTIFY: Y | REPLY | REPLY WITH QUOTE | PERMALINK | TOP | HOME
I will refer to this set of data as Table JSF-URF-1
Found some data prior to 10 years ago:
Jan 2002 is listed twice. First with original report data from February 2002. Second with revised data from new Census data, published in February 2003.
Quote:
Originally posted by JEWELSTAITEFAN:
BLS currently defines the Want A Job category as not being part of the Labor Force.
So I will post some actual numbers and let the comparisons and discussion follow. The documented shenanigans of Obamabots deliberately refusing to Report jobless data in the months before the 2012 Election are a different matter, I will just use the Fake Data they produced and pretend it was real.
I will use only the Unadjusted numbers, to help maintain clarity and transparency.
Mo/Yr Unemp Pcnt WAJb Pcnt SubTtl Prcnt InvPT Pcnt Total Percnt CivPop LbrForc Prtc% U-6%
Jan98 07069 05.2% 5026 3.7% 12095 08.9% 4090 3.0% 16185 11.9% 204238 135951 66.6 09.3
Jan99 06604 04.8% 4800 3.5% 11404 08.3% 3645 2.6% 15049 10.9% 206719 137943 66.7 08.5
Jan00 06316 04.5% 4354 3.1% 10670 07.6% 3355 2.4% 14025 10.0% 208782 139621 66.9 07.8
Jan01 06647 04.7% 4474 3.2% 11121 07.9% 3559 2.5% 14680 10.4% 210889 141049 66.9 08.1
Jan02 08935 06.3% 4872 3.5% 13807 09.8% 4249 3.0% 18056 12.8% 213089 141074 66.2 10.5
Jan02 09051 06.3% 4938 3.4% 13989 09.8% 4453 3.1% 18442 12.9% 216506 143228 66.2 10.5
Jan03 09395 06.5% 4779 3.3% 14174 09.8% 5003 3.4% 19177 13.2% 219897 145301 66.1 11.0
Jan04 09144 06.3% 4913 3.4% 14057 09.6% 5152 3.5% 19209 13.2% 222161 146068 65.7 10.9
Jan05 08444 05.7% 5136 3.5% 13580 09.2% 4793 3.3% 18373 12.5% 224837 147125 65.4 10.2
Jan06 07608 05.1% 5095 3.4% 12703 08.5% 4513 3.0% 17216 11.5% 227553 149090 65.5 09.2
Jan07 07649 05.0% 4633 3.0% 12282 08.1% 4620 3.0% 16902 11.1% 230650 151924 65.9 09.1
Jan08 08221 05.4% 4977 3.2% 13198 08.6% 5235 3.5% 18433 12.1% 232616 152828 65.7 09.9
Jan09 13009 08.5% 5866 3.8% 18875 12.3% 8675 5.7% 27550 18.0% 234739 153445 65.4 15.4
Jan10 16147 10.6% 6108 4.0% 22255 14.6% 9161 5.9% 31416 20.5% 236832 152957 64.6 18.0
Jan11 14937 09.8% 6643 4.3% 21580 14.1% 9027 6.0% 30607 20.1% 238704 152536 63.9 17.3
Jan12 13541 08.8% 6495 4.3% 20036 13.1% 8747 5.7% 28783 18.8% 242269 153485 63.4 16.2
Jan13 13181 08.5% 6781 4.4% 19962 12.9% 8506 5.5% 28468 18.4% 244663 154794 63.3 15.4
Jan14 10855 07.0% 6508 4.2% 17363 11.2% 7617 5.0% 24980 16.2% 246915 154381 62.5 13.5
Jan15 09498 06.1% 6467 4.1% 15965 10.2% 7125 4.6% 23090 14.8% 249723 156050 62.5 12.0
Jan16 08309 05.3% 6166 3.9% 14475 09.2% 6234 4.0% 20709 13.2% 252397 157347 62.3 10.5
Jan17 08149 05.1% 5934 3.8% 14083 08.9% 6127 3.8% 20210 12.7% 254082 158676 62.5 10.1
Jan18 07189 04.5% 5364 3.3% 12553 07.8% 5380 3.4% 17933 11.2% 256780 160037 62.3 08.9
Feb18 07091 04.4% 5152 3.2% 12243 07.6% 5241 3.2% 17484 10.8% 256934 161494 62.9 08.6
Mar18 06671 04.1% 4793 3.0% 11464 07.1% 4975 3.1% 16439 10.2% 257097 161548 62.8 08.1
Jul 12 13400 08.6% 6837 4.3% 20237 12.9% 8218 5.3% 28455 18.2% 243354 156526 64.3 15.2
Aug12 12696 08.2% 7631 4.9% 20327 13.1% 7723 5.0% 28050 18.1% 243566 155255 63.7 14.6
Sep12 11742 07.6% 6427 4.1% 18169 11.7% 8003 5.2% 26172 16.9% 243772 155075 63.6 14.2
Oct12 11741 07.5% 6142 4.0% 17883 11.5% 7768 5.0% 25651 16.5% 243983 155779 63.8 13.9
Nov12 11404 07.4% 6495 4.2% 17899 11.6% 7898 5.0% 25797 16.6% 244174 154953 63.5 13.9
Quote:
The Civilian Adult Population steadily Increases, suggesting that figure is not manipulated.
The Unemployment Rate after 2008 was able to be artificially less by shifting more unemployedNOTIFY: Y | REPLY | REPLY WITH QUOTE | PERMALINK | TOP | HOME
Quote:
Originally posted by JEWELSTAITEFAN:Quote:Sure.
Originally posted by 6IXSTRINGJACK:
It's not readable here. You should probably link the source table, or create a google spreadsheet with the data.
Do Right, Be Right. :)
You find a source with all the relevent data, or create your spreadsheet, and then post it.
I'm not doing your work for you.
I'm also not debating your numbers until you can provide them in a readable format.
As far as I'm concerned, until you do either, you're just making those numbers up.
Do Right, Be Right. :)
NOTIFY: Y | REPLY | REPLY WITH QUOTE | PERMALINK | TOP | HOME
Quote:Are the figures in the split tables of last evening, around 8pm, in a readable format for you? If not, what is not readable? Are the rows word-wrapped?
Originally posted by 6IXSTRINGJACK:Quote:
Originally posted by JEWELSTAITEFAN:Quote:Sure.
Originally posted by 6IXSTRINGJACK:
It's not readable here. You should probably link the source table, or create a google spreadsheet with the data.
You find a source with all the relevent data, or create your spreadsheet, and then post it.
I'm not doing your work for you.
I'm also not debating your numbers until you can provide them in a readable format.
As far as I'm concerned, until you do either, you're just making those numbers up.
NOTIFY: Y | REPLY | REPLY WITH QUOTE | PERMALINK | TOP | HOME
Quote:
Originally posted by JEWELSTAITEFAN:Quote:Are the figures in the split tables of last evening, around 8pm, in a readable format for you? If not, what is not readable? Are the rows word-wrapped?
Originally posted by 6IXSTRINGJACK:Quote:
Originally posted by JEWELSTAITEFAN:Quote:Sure.
Originally posted by 6IXSTRINGJACK:
It's not readable here. You should probably link the source table, or create a google spreadsheet with the data.
You find a source with all the relevent data, or create your spreadsheet, and then post it.
I'm not doing your work for you.
I'm also not debating your numbers until you can provide them in a readable format.
As far as I'm concerned, until you do either, you're just making those numbers up.
The rows are word wrapped. The column headers are longer than the columns in some instances, and not as long as the columns in other instances. The column headers are abbreviated and aren't always easy to figure out what they're for. Individual data is broken up by only a single space which also makes it almost impossible to read when you're talking about 400-500 points of data, especially when some rows have data with a different amount of total characters in each "cell" than another row.
Forums are not the place for this type of raw data to be displayed. I could be wrong about this, but even if FFF.NET was using cutting edge forum technology I don't believe that it would display graphs properly either.
Sorry man. I just get a headache looking at this. I'm pretty sure that you're looking at exactly what I'm looking at. I'm not sure how you think that's readable.
Do Right, Be Right. :)
NOTIFY: Y | REPLY | REPLY WITH QUOTE | PERMALINK | TOP | HOME
Quote:OK. I'm not getting a word wrap, or else I would know what you see.
Originally posted by 6IXSTRINGJACK:Quote:The rows are word wrapped. The column headers are longer than the columns in some instances, and not as long as the columns in other instances. The column headers are abbreviated and aren't always easy to figure out what they're for. Individual data is broken up by only a single space which also makes it almost impossible to read when you're talking about 400-500 points of data, especially when some rows have data with a different amount of total characters in each "cell" than another row.
Originally posted by JEWELSTAITEFAN:Quote:Are the figures in the split tables of last evening, around 8pm, in a readable format for you? If not, what is not readable? Are the rows word-wrapped?
Originally posted by 6IXSTRINGJACK:Quote:I'm not doing your work for you.
Originally posted by JEWELSTAITEFAN:Quote:Sure.
Originally posted by 6IXSTRINGJACK:
It's not readable here. You should probably link the source table, or create a google spreadsheet with the data.
You find a source with all the relevent data, or create your spreadsheet, and then post it.
I'm also not debating your numbers until you can provide them in a readable format.
As far as I'm concerned, until you do either, you're just making those numbers up.
Forums are not the place for this type of raw data to be displayed. I could be wrong about this, but even if FFF.NET was using cutting edge forum technology I don't believe that it would display graphs properly either.
Sorry man. I just get a headache looking at this. I'm pretty sure that you're looking at exactly what I'm looking at. I'm not sure how you think that's readable.
Do Right, Be Right. :)
Can you tell me, for instance, which header word is where the wrap starts for you?
Thanks for your help.
NOTIFY: Y | REPLY | REPLY WITH QUOTE | PERMALINK | TOP | HOME
Adding to this Table of Data, which seems to best show the components of U6:
Quote:
I will post some actual numbers and let the comparisons and discussion follow. The documented shenanigans of Obamabots deliberately refusing to Report jobless data in the months before the 2012 Election are a different matter, I will just use the Fake Data they produced and pretend it was real.
The BLS uses both Seasonally Adjusted figures and Unadjusted figures, and interchanges them without clearly identifying so. For example, the current Rate of 4.1% (for 4 months straight) is SeasAdj, and the real Rate is 4.5% for Jan 2018. I will use only the Unadjusted numbers, to help maintain clarity and transparency.
Some numbers may have a 0 placed as first digit, to maintain column form in this format.
The 1st column of numbers is the unemployed. The 2nd column is the Rate.
The 3rd column is what is called Marginally Attached to the Labor Force, which is included in the Want A Job Now category but NOT included in the Labor Force category and therefore excluded from the reported Unemployment category. The 5th column is the sum of Unemployed plus Marginally Attached - which more accurately represents the Actual Unemployed. The 6th column is the Rate for column 5 figure.
The 7th column is the Involuntary Part-Time workers, who are Not Employed Full Time due to poor Economy, and want, are able to work FT. The 8th column is the sum of the 5th column plus 7th column. 9th column is the Rate for column 8 figure.
The 10th column is the Civilian Population. 11th column is Labor Force, 12th column is Participation Rate. 13th column is the published U-6 figure.
Figures in thousands.
Mo/Yr Unemp Pcnt MrgAt Pcnt SubTtl Prcnt InvPT Pcnt Total Percnt CivPop LbrForc Prtc% U6%
Jan94 09492 07.3% 2120 1.6% 11612 09.0% 4963 3.8% 16575 12.8% 195953 129393 66.0
Jan95 08101 06.2% 1783 1.4% 09884 07.6% 4620 3.5% 14504 11.1% 197753 130698 66.1
Jan96 08270 06.3% 1737 1.3% 10007 07.6% 4103 3.1% 14110 10.7% 199634 131396 65.8 10.8
Jan97 07933 05.9% 1615 1.2% 09548 07.1% 4338 3.2% 13886 10.3% 202285 134317 66.4 10.4
Jan98 07069 05.2% 1479 1.1% 08548 06.3% 4090 3.0% 12638 09.3% 204238 135951 66.6 09.3
Jan99 06604 04.8% 1358 1.0% 07962 05.8% 3645 2.6% 11607 08.4% 206719 137943 66.7 08.5
Jan00 06316 04.5% 1197 0.9% 07513 05.4% 3355 2.4% 10868 07.8% 208782 139621 66.9 07.8
Jan01 06647 04.7% 1290 0.9% 07937 05.6% 3559 2.5% 11496 08.2% 210889 141049 66.9 08.1
Jan02 08935 06.3% 1509 1.1% 10444 07.4% 4249 3.0% 14693 10.4% 213089 141074 66.2 10.5
Jan02 09051 06.3% 1532 1.1% 10583 07.4% 4453 3.1% 15036 10.5% 216506 143228 66.2 10.5
Jan03 09395 06.5% 1598 1.1% 10993 07.6% 5003 3.4% 15996 11.0% 219897 145301 66.1 11.0
Jan04 09144 06.3% 1670 1.1% 10814 07.4% 5152 3.5% 15966 10.9% 222161 146068 65.7 10.9
Jan05 08444 05.7% 1804 1.2% 10248 07.0% 4793 3.3% 15041 10.2% 224837 147125 65.4 10.2
Jan06 07608 05.1% 1644 1.1% 09252 06.2% 4513 3.0% 13765 09.2% 227553 149090 65.5 09.2
Jan07 07649 05.0% 1577 1.0% 09226 06.1% 4620 3.0% 13846 09.1% 230650 151924 65.9 09.1
Jan08 08221 05.4% 1729 1.1% 09950 06.5% 5235 3.4% 15185 09.9% 232616 152828 65.7 09.9
Jan09 13009 08.5% 2130 1.4% 15139 09.9% 8675 5.6% 23814 15.5% 234739 153445 65.4 15.4
Jan10 16147 10.6% 2539 1.6% 18686 12.2% 9161 6.0% 27847 18.2% 236832 152957 64.6 18.0
Jan11 14937 09.8% 2800 1.8% 17737 11.6% 9027 5.9% 26764 17.5% 238704 152536 63.9 17.3
Jan12 13541 08.8% 2809 1.9% 16350 10.7% 8747 5.7% 25097 16.4% 242269 153485 63.4 16.2
Jan13 13181 08.5% 2443 1.6% 15624 10.1% 8506 5.5% 24130 15.6% 244663 154794 63.3 15.4
Jan14 10855 07.0% 2592 1.7% 13447 08.7% 7617 4.9% 21064 13.6% 246915 154381 62.5 13.5
Jan15 09498 06.1% 2234 1.4% 11732 07.5% 7125 4.6% 18857 12.1% 249723 156050 62.5 12.0
Jan16 08309 05.3% 2089 1.3% 10398 06.6% 6234 4.0% 16632 10.6% 252397 157347 62.3 10.5
Jan17 08149 05.1% 1752 1.1% 09901 06.2% 6127 3.9% 16028 10.1% 254082 158676 62.5 10.1
Jan18 07189 04.5% 1653 1.0% 08842 05.5% 5380 3.4% 14222 08.9% 256780 160037 62.3 0
NOTIFY: Y | REPLY | REPLY WITH QUOTE | PERMALINK | TOP | HOME
Quote:
Originally posted by JEWELSTAITEFAN:Quote:OK. I'm not getting a word wrap, or else I would know what you see.
Originally posted by 6IXSTRINGJACK:Quote:The rows are word wrapped. The column headers are longer than the columns in some instances, and not as long as the columns in other instances. The column headers are abbreviated and aren't always easy to figure out what they're for. Individual data is broken up by only a single space which also makes it almost impossible to read when you're talking about 400-500 points of data, especially when some rows have data with a different amount of total characters in each "cell" than another row.
Originally posted by JEWELSTAITEFAN:Quote:Are the figures in the split tables of last evening, around 8pm, in a readable format for you? If not, what is not readable? Are the rows word-wrapped?
Originally posted by 6IXSTRINGJACK:Quote:I'm not doing your work for you.
Originally posted by JEWELSTAITEFAN:Quote:Sure.
Originally posted by 6IXSTRINGJACK:
It's not readable here. You should probably link the source table, or create a google spreadsheet with the data.
You find a source with all the relevent data, or create your spreadsheet, and then post it.
I'm also not debating your numbers until you can provide them in a readable format.
As far as I'm concerned, until you do either, you're just making those numbers up.
Forums are not the place for this type of raw data to be displayed. I could be wrong about this, but even if FFF.NET was using cutting edge forum technology I don't believe that it would display graphs properly either.
Sorry man. I just get a headache looking at this. I'm pretty sure that you're looking at exactly what I'm looking at. I'm not sure how you think that's readable.
Do Right, Be Right. :)
Can you tell me, for instance, which header word is where the wrap starts for you?
Thanks for your help.
Just taking a random line from your post, here's what I'm looking at:
Jan02 09051 06.3% 4938 3.4% 13989 09.8% 4453 3.1% 18442 12.9% 216506 143228 66.2 10.5
The last figure of that line is 216506.
So the wrapped part of the line is "143228 66.2 10.5"
On my screen that line reads as follows:
Jan02 09051 06.3% 4938 3.4% 13989 09.8% 4453 3.1% 18442 12.9% 216506
143228 66.2 10.5
Every line looks like this, so you can imagine how difficult it would be to try to match any of this data up to the Column Headers.
In fact, the column header now looks like this to me:
Mo/Yr Unemp Pcnt WAJb Pcnt SubTtl Prcnt InvPT Pcnt Total Percnt CivPop LbrForc Prtc%
U-6%
With the "U-6%" on the second line.
It should be noted that this entire post looks different than it did before you asked the question. I don't believe it was in bold before. I'm sure that adding it in bold only increases the amount that shows up on the second line, but even when it wasn't bold this data never fit on one line per row.
Do Right, Be Right. :)
NOTIFY: Y | REPLY | REPLY WITH QUOTE | PERMALINK | TOP | HOME
Quote:Thanks for the info. I will try to make adjustments, but not tonight.
Originally posted by 6IXSTRINGJACK:Quote:Just taking a random line from your post, here's what I'm looking at:
Originally posted by JEWELSTAITEFAN:Quote:OK. I'm not getting a word wrap, or else I would know what you see.
Originally posted by 6IXSTRINGJACK:Quote:The rows are word wrapped. The column headers are longer than the columns in some instances, and not as long as the columns in other instances. The column headers are abbreviated and aren't always easy to figure out what they're for. Individual data is broken up by only a single space which also makes it almost impossible to read when you're talking about 400-500 points of data, especially when some rows have data with a different amount of total characters in each "cell" than another row.
Originally posted by JEWELSTAITEFAN:Quote:Are the figures in the split tables of last evening, around 8pm, in a readable format for you? If not, what is not readable? Are the rows word-wrapped?
Originally posted by 6IXSTRINGJACK:
I'm also not debating your numbers until you can provide them in a readable format.
As far as I'm concerned, until you do either, you're just making those numbers up.
Forums are not the place for this type of raw data to be displayed. I could be wrong about this, but even if FFF.NET was using cutting edge forum technology I don't believe that it would display graphs properly either.
Sorry man. I just get a headache looking at this. I'm pretty sure that you're looking at exactly what I'm looking at. I'm not sure how you think that's readable.
Do Right, Be Right. :)
Can you tell me, for instance, which header word is where the wrap starts for you?
Thanks for your help.
Jan02 09051 06.3% 4938 3.4% 13989 09.8% 4453 3.1% 18442 12.9% 216506 143228 66.2 10.5
The last figure of that line is 216506.
So the wrapped part of the line is "143228 66.2 10.5"
On my screen that line reads as follows:
Jan02 09051 06.3% 4938 3.4% 13989 09.8% 4453 3.1% 18442 12.9% 216506
143228 66.2 10.5
Every line looks like this, so you can imagine how difficult it would be to try to match any of this data up to the Column Headers.
In fact, the column header now looks like this to me:
Mo/Yr Unemp Pcnt WAJb Pcnt SubTtl Prcnt InvPT Pcnt Total Percnt CivPop LbrForc Prtc%
U-6%
With the "U-6%" on the second line.
It should be noted that this entire post looks different than it did before you asked the question. I don't believe it was in bold before. I'm sure that adding it in bold only increases the amount that shows up on the second line, but even when it wasn't bold this data never fit on one line per row.
Do Right, Be Right. :)
So the 2 Split Tables are also both still word-wrapping for you?
NOTIFY: Y | REPLY | REPLY WITH QUOTE | PERMALINK | TOP | HOME
Quote:
Originally posted by JEWELSTAITEFAN:
Thanks for the info. I will try to make adjustments, but not tonight.
So the 2 Split Tables are also both still word-wrapping for you?
No problem.
The last post you made with table data is not word wrapping.
That's not to say that it's easy to read, because it still isn't on a forum, but at least the word wrapping isn't getting in the way on that post.
EDIT:
My mistake. Two lines are still wrapping. The last column wraps on these two lines:
Feb2018 07091 04.4% 1602 1.0% 08693 05.4% 5241 3.2% 13934 08.6% 256934 161494 62.9 08.6
Mar2018 06671 04.1% 1454 0.9% 08125 05.0% 4975 3.1% 13100 08.1% 257097 161548 62.8 08.1
It looks like there is the same amount of characters in the lines, but I think that "Feb" and "Mar" might just be slightly larger than "Jan".
I wonder if you can change to a mono-spaced font in here with a tag? I'm not sure what one would be good though. "Courier New" is mono-spaced, but it's rather wide and you'd be wrapping the rows for sure if you used it.
Do Right, Be Right. :)
NOTIFY: Y | REPLY | REPLY WITH QUOTE | PERMALINK | TOP | HOME
Quote:I wish this site had Courier New, my life would be so much easier.
Originally posted by 6IXSTRINGJACK:Quote:No problem.
Originally posted by JEWELSTAITEFAN:
Thanks for the info. I will try to make adjustments, but not tonight.
So the 2 Split Tables are also both still word-wrapping for you?
The last post you made with table data is not word wrapping.
That's not to say that it's easy to read, because it still isn't on a forum, but at least the word wrapping isn't getting in the way on that post.
EDIT:
My mistake. Two lines are still wrapping. The last column wraps on these two lines:
Feb2018 07091 04.4% 1602 1.0% 08693 05.4% 5241 3.2% 13934 08.6% 256934 161494 62.9 08.6
Mar2018 06671 04.1% 1454 0.9% 08125 05.0% 4975 3.1% 13100 08.1% 257097 161548 62.8 08.1
It looks like there is the same amount of characters in the lines, but I think that "Feb" and "Mar" might just be slightly larger than "Jan".
I wonder if you can change to a mono-spaced font in here with a tag? I'm not sure what one would be good though. "Courier New" is mono-spaced, but it's rather wide and you'd be wrapping the rows for sure if you used it.
Do Right, Be Right. :)
Are those 2 lines still wrapping now?
NOTIFY: Y | REPLY | REPLY WITH QUOTE | PERMALINK | TOP | HOME
The data in my Tables regarding Unemployment Rates are compiled from the BLS Reports.
Here is a link to the Reports, you may dig for and confirm/verify any data you choose:
https://www.bls.gov/bls/news-release/home.htm
The reports provide the current data, plus the data from the report 12 months prior. Except from Jan 2002, where the data from that report and previous years are not compatible or adjusted to mesh with the Jan 2003 report of Jan 2002 data plus all later reports.
The Unemployed count and associated Unemployment Rate are found in Table A-1 of each report. The Rate is defined as the count divided by the Civilian Labor Force.
The Want A Job data is found sometimes in Table A-1 or in a later Table of the A series, depending upon which year of the report. The percentage is the count divided by Civilian Labor Force.
The Marginally Attached data is, with various descriptions, in one of the A-series Tables, the specific location changing depending upon which year of the report. The percentage is the count divided by Civilian Labor Force.
The Subtotal is the first 2 data columns summed, and then the percent is after division by Civilian Labor Force.
Involuntary Part-Time is listed, with various descriptions, in one of the later A-series Tables, differing dependant upon the year of the report. The percentage is the count divided by Civilian Labor Force.
The total is the sum of the Subtotal and InvPT. Division by Civilian Labor Force produces the percent.
The Civilian uninstitutional Population, the Civilian Labor Force, and the Labor Participation Rate are located in Table A-1 of each report. The Participation Rate is defined as Civilian Labor Force divided by Civilian uninstitutional Population. The Labor Force is defined as Employed plus Unemployed.
The U-6 figure is usually found in one of the middle or later A-series Tables. The figure published does not always seem to match what the proclaimed definition produces.
NOTIFY: Y | REPLY | REPLY WITH QUOTE | PERMALINK | TOP | HOME
Quote:
Originally posted by JEWELSTAITEFAN:
The data in my Tables regarding Unemployment Rates are compiled from the BLS Reports.
Here is a link to the Reports, you may dig for and confirm/verify any data you choose:
https://www.bls.gov/bls/news-release/home.htm
I can see now why you were reluctant to go the extra mile. I had no idea that you were compiling data from that site.
Why do I get the feeling that this stuff is intentionally obfuscated?
There is nothing at all intuitive about that website. I applaud your efforts to try to put the data together. We'll have to figure out a way to make it intelligible outside of this forum.
Do Right, Be Right. :)
NOTIFY: Y | REPLY | REPLY WITH QUOTE | PERMALINK | TOP | HOME
Quote:Well, now that I've compiled the data from disparate source locations, it should be relatively easy to transfer to your preferred format template. Select the "reply with quote" function, select and move the text to a word processing document to work with it, delete the font commands that I added in, then most format templates will allow a merge of columns and rows into the format.
Originally posted by 6IXSTRINGJACK:Quote:I can see now why you were reluctant to go the extra mile. I had no idea that you were compiling data from that site.
Originally posted by JEWELSTAITEFAN:
The data in my Tables regarding Unemployment Rates are compiled from the BLS Reports.
Here is a link to the Reports, you may dig for and confirm/verify any data you choose:
https://www.bls.gov/bls/news-release/home.htm
Why do I get the feeling that this stuff is intentionally obfuscated?
There is nothing at all intuitive about that website. I applaud your efforts to try to put the data together. We'll have to figure out a way to make it intelligible outside of this forum.
Do Right, Be Right. :)
You could even command Courier New font, reduce Font Size to your liking (or use Landscape Orientation), and convert to PDF.
NOTIFY: Y | REPLY | REPLY WITH QUOTE | PERMALINK | TOP | HOME
Here is a linky to the Food Stamp data, recipients and expenditures. Apparently Libtards have been feverishly denying any and all numbers in this report, since it reflects badly upon Obama.
[img] https://fns-prod.azureedge.net/sites/default/files/pd/SNAPsummary.pdf[/img]
And I'll try to list some of that data here.
Figures in millions.
Year Particip Expndtr %Pop
2005 25.628
2006 26.549
2007 26.316
2008 28.223
2009 33.490
2010 40.302
2011 44.709
2012 46.609
2013 47.636
2014 46.664
2015 45.767
2016 44.219
2017 42.205 $68.108
NOTIFY: Y | REPLY | REPLY WITH QUOTE | PERMALINK | TOP | HOME
Quote:Obama got a late start in 2009, but kicked off 2017 with plenty of waste. From the years of Obamanomics 2009-2017, adding up all the participants comes to 391,601,000 participant-years. Accounting for 34% of the entire lifetime of the freeloading program.
Originally posted by JEWELSTAITEFAN:
Here is a linky to the Food Stamp data, recipients and expenditures. Apparently Libtards have been feverishly denying any and all numbers in this report, since it reflects badly upon Obama.
https://fns-prod.azureedge.net/sites/default/files/pd/SNAPsummary.pdf
The grand total of Food Stamp participants before Obama was only 749,396,000 from 1969-2008 (40 years).
The 16 years prior to Obamanomics (1993-2008) totalled 380,853,000.
The first 34 years of Food Stamps (1969-1992) summed to 368,543,000.
NOTIFY: Y | REPLY | REPLY WITH QUOTE | PERMALINK | TOP | HOME
Quote:
Originally posted by JEWELSTAITEFAN:Quote:Obama got a late start in 2009, but kicked off 2017 with plenty of waste. From the years of Obamanomics 2009-2017, adding up all the participants comes to 391,601,000 participant-years. Accounting for 34% of the entire lifetime of the freeloading program.
Originally posted by JEWELSTAITEFAN:
Here is a linky to the Food Stamp data, recipients and expenditures. Apparently Libtards have been feverishly denying any and all numbers in this report, since it reflects badly upon Obama.
https://fns-prod.azureedge.net/sites/default/files/pd/SNAPsummary.pdf
The grand total of Food Stamp participants before Obama was only 749,396,000 from 1969-2008 (40 years).
The 16 years prior to Obamanomics (1993-2008) totalled 380,853,000.
The first 34 years of Food Stamps (1969-1992) summed to 368,543,000.
I don't consider it a freeloading program.
When I think about all of the wasteful expenditures of my tax dollars, providing food for people isn't one that particularly annoys me. Are there people who benefit from it that shouldn't? I'm sure the answer to that is yes. But there are a lot of people who depend on it.
It's amazing how quickly a "good person" could turn "bad" when they're starving. Unless you live in a gated and armed community, I would view paying for food stamps as one of the most sensible tax expenditures that you have as somebody fortunate enough to still have gainful employment in 2018.
It's one of the reasons your home isn't being broken into every other day.
Sure. I know you're personally armed and that breaking into your home wouldn't end in a very favorable result by anyone foolish enough to attempt to do it, but really, do you want that hassle of calling the cops and having a hazmat crew come in and clean up the mess?
Do you have any idea how much a hazmat team costs per call? I actually do. It usually ranges between $10,000 and $15,000 per minor incident.
You're not going to be the one paying for that cleanup when it happens, so who pays for it? That's right. The American tax payer. So now you've just cost the American Taxpayer about 12 times the cost of a single person's maximum yearly food stamp benefits to clean somebody off of your walls and floor who used to receive the benefits.
And then next month when somebody else tries it, you're going to spend another dozen people's full year of food stamp benefits on a single cleanup procedure.
Wash, rinse, repeat...
Well.... that is assuming you never miss your target.
Do Right, Be Right. :)
NOTIFY: Y | REPLY | REPLY WITH QUOTE | PERMALINK | TOP | HOME
Quote:In the reports I was reading on the Food Stamp program, it was pointed out that about 1% of the population needed food assistance. But over 14% have been receiving it.
Originally posted by 6IXSTRINGJACK:Quote:I don't consider it a freeloading program.
Originally posted by JEWELSTAITEFAN:Quote:Obama got a late start in 2009, but kicked off 2017 with plenty of waste. From the years of Obamanomics 2009-2017, adding up all the participants comes to 391,601,000 participant-years. Accounting for 34% of the entire lifetime of the freeloading program.
Originally posted by JEWELSTAITEFAN:
Here is a linky to the Food Stamp data, recipients and expenditures. Apparently Libtards have been feverishly denying any and all numbers in this report, since it reflects badly upon Obama.
https://fns-prod.azureedge.net/sites/default/files/pd/SNAPsummary.pdf
The grand total of Food Stamp participants before Obama was only 749,396,000 from 1969-2008 (40 years).
The 16 years prior to Obamanomics (1993-2008) totalled 380,853,000.
The first 34 years of Food Stamps (1969-1992) summed to 368,543,000.
When I think about all of the wasteful expenditures of my tax dollars, providing food for people isn't one that particularly annoys me. Are there people who benefit from it that shouldn't? I'm sure the answer to that is yes. But there are a lot of people who depend on it.
It's amazing how quickly a "good person" could turn "bad" when they're starving. Unless you live in a gated and armed community, I would view paying for food stamps as one of the most sensible tax expenditures that you have as somebody fortunate enough to still have gainful employment in 2018.
It's one of the reasons your home isn't being broken into every other day.
Providing the assistance to those who need it is an essential portion of the Social Safety Net.
The remaining abuse is wasteful spending on parasites, to the detriment of the truly needy and deserving.
Spurring participants to avoid gainful employment in order to get Free Government Money is wasteful spending.
Government handouts to Illegal Aliens is wasteful spending.
Wasting $65 Billion extra on a $5 Billion program does not seem truly beneficial.
NOTIFY: Y | REPLY | REPLY WITH QUOTE | PERMALINK | TOP | HOME
Quote:
Originally posted by JEWELSTAITEFAN:Quote:In the reports I was reading on the Food Stamp program, it was pointed out that about 1% of the population needed food assistance. But over 14% have been receiving it.
Originally posted by 6IXSTRINGJACK:Quote:I don't consider it a freeloading program.
Originally posted by JEWELSTAITEFAN:Quote:Obama got a late start in 2009, but kicked off 2017 with plenty of waste. From the years of Obamanomics 2009-2017, adding up all the participants comes to 391,601,000 participant-years. Accounting for 34% of the entire lifetime of the freeloading program.
Originally posted by JEWELSTAITEFAN:
Here is a linky to the Food Stamp data, recipients and expenditures. Apparently Libtards have been feverishly denying any and all numbers in this report, since it reflects badly upon Obama.
https://fns-prod.azureedge.net/sites/default/files/pd/SNAPsummary.pdf
The grand total of Food Stamp participants before Obama was only 749,396,000 from 1969-2008 (40 years).
The 16 years prior to Obamanomics (1993-2008) totalled 380,853,000.
The first 34 years of Food Stamps (1969-1992) summed to 368,543,000.
When I think about all of the wasteful expenditures of my tax dollars, providing food for people isn't one that particularly annoys me. Are there people who benefit from it that shouldn't? I'm sure the answer to that is yes. But there are a lot of people who depend on it.
It's amazing how quickly a "good person" could turn "bad" when they're starving. Unless you live in a gated and armed community, I would view paying for food stamps as one of the most sensible tax expenditures that you have as somebody fortunate enough to still have gainful employment in 2018.
It's one of the reasons your home isn't being broken into every other day.
Providing the assistance to those who need it is an essential portion of the Social Safety Net.
The remaining abuse is wasteful spending on parasites, to the detriment of the truly needy and deserving.
Spurring participants to avoid gainful employment in order to get Free Government Money is wasteful spending.
Government handouts to Illegal Aliens is wasteful spending.
Wasting $65 Billion extra on a $5 Billion program does not seem truly beneficial.
You've never been on them, so I think you have a very limited perspective of it. I'd say the same thing for anybody who wrote that report.
I don't think you have any idea what it means to live on a wage making around 10 to 12 thousand per year.
Fortunately, I don't have a mortgage or rent, and even more fortunately I don't have children to feed. I can only imagine that it's near impossible to raise and feed children on that kind of money. Especially if you're a single parent.
Feel free to sit back and judge other people for the positions they find themselves in because of the choices they've made. But that's not going to give them education or training they need to put themselves in a better one. It's not going to put food on the table either.
I do have to say that I liked that I was cut off after I wasn't working anymore. I don't think anybody should be getting food stamps if they're not willing to work 20 hours a week. And now that I am working again I make too much money to get them anyhow. I'm looking at clearing $14 in 2018 before taxes.
Talk to me about who needs food assistance the next time you make less than that in a year.
Do Right, Be Right. :)
NOTIFY: Y | REPLY | REPLY WITH QUOTE | PERMALINK | TOP | HOME
Quote:I don't think I said there was no need.
Originally posted by 6IXSTRINGJACK:Quote:You've never been on them, so I think you have a very limited perspective of it. I'd say the same thing for anybody who wrote that report.
Originally posted by JEWELSTAITEFAN:Quote:In the reports I was reading on the Food Stamp program, it was pointed out that about 1% of the population needed food assistance. But over 14% have been receiving it.
Originally posted by 6IXSTRINGJACK:Quote:I don't consider it a freeloading program.
Originally posted by JEWELSTAITEFAN:Quote:Obama got a late start in 2009, but kicked off 2017 with plenty of waste. From the years of Obamanomics 2009-2017, adding up all the participants comes to 391,601,000 participant-years. Accounting for 34% of the entire lifetime of the freeloading program.
Originally posted by JEWELSTAITEFAN:
Here is a linky to the Food Stamp data, recipients and expenditures. Apparently Libtards have been feverishly denying any and all numbers in this report, since it reflects badly upon Obama.
https://fns-prod.azure
edge.net/sites/default/fil
es/pd/SNAPsummary.pdf
The grand total of Food Stamp participants before Obama was only 749,396,000 from 1969-2008 (40 years).
The 16 years prior to Obamanomics (1993-2008) totalled 380,853,000.
The first 34 years of Food Stamps (1969-1992) summed to 368,543,000.
When I think about all of the wasteful expenditures of my tax dollars, providing food for people isn't one that particularly annoys me. Are there people who benefit from it that shouldn't? I'm sure the answer to that is yes. But there are a lot of people who depend on it.
It's amazing how quickly a "good person" could turn "bad" when they're starving. Unless you live in a gated and armed community, I would view paying for food stamps as one of the most sensible tax expenditures that you have as somebody fortunate enough to still have gainful employment in 2018.
It's one of the reasons your home isn't being broken into every other day.
Providing the assistance to those who need it is an essential portion of the Social Safety Net.
The remaining abuse is wasteful spending on parasites, to the detriment of the truly needy and deserving.
Spurring participants to avoid gainful employment in order to get Free Government Money is wasteful spending.
Government handouts to Illegal Aliens is wasteful spending.
Wasting $65 Billion extra on a $5 Billion program does not seem truly beneficial.
I don't think you have any idea what it means to live on a wage making around 10 to 12 thousand per year.
Fortunately, I don't have a mortgage or rent, and even more fortunately I don't have children to feed. I can only imagine that it's near impossible to raise and feed children on that kind of money. Especially if you're a single parent.
Feel free to sit back and judge other people for the positions they find themselves in because of the choices they've made. But that's not going to give them education or training they need to put themselves in a better one. It's not going to put food on the table either.
I do have to say that I liked that I was cut off after I wasn't working anymore. I don't think anybody should be getting food stamps if they're not willing to work 20 hours a week. And now that I am working again I make too much money to get them anyhow. I'm looking at clearing $14 in 2018 before taxes.
Talk to me about who needs food assistance the next time you make less than that in a year.
Do Right, Be Right. :)
$10-12k per year. That would be about $5-6 per hour for 40 hours per week, with no overtime or tips. Or about $10-12 per hour for 20 hours per week.
Of those who are the breadwinners in a family, how many in America do you think have income of $10-12k per year?
NOTIFY: Y | REPLY | REPLY WITH QUOTE | PERMALINK | TOP | HOME
Quote:
Originally posted by JEWELSTAITEFAN:
I don't think I said there was no need.
$10-12k per year. That would be about $5-6 per hour for 40 hours per week, with no overtime or tips. Or about $10-12 per hour for 20 hours per week.
Of those who are the breadwinners in a family, how many in America do you think have income of $10-12k per year?
I wouldn't know. There's a lot of adults working jobs that children used to work these days. Many of them pay national minimum wage or very close to it. Most of them aren't full time and provide zero benefits. I've worked enough shitty jobs to know this.
I think maybe you need to slum it for a while and walk a mile in another man's shoes before you speak about things.
Either that, or start bitching about where your tax dollars are going other than to provide food for people who need it.
Do Right, Be Right. :)
NOTIFY: Y | REPLY | REPLY WITH QUOTE | PERMALINK | TOP | HOME
Quote:I said breadwinners. Such as Head of Families.
Originally posted by 6IXSTRINGJACK:Quote:I wouldn't know. There's a lot of adults working jobs that children used to work these days. Many of them pay national minimum wage or very close to it. Most of them aren't full time and provide zero benefits. I've worked enough shitty jobs to know this.
Originally posted by JEWELSTAITEFAN:
I don't think I said there was no need.
$10-12k per year. That would be about $5-6 per hour for 40 hours per week, with no overtime or tips. Or about $10-12 per hour for 20 hours per week.
Of those who are the breadwinners in a family, how many in America do you think have income of $10-12k per year?
I think maybe you need to slum it for a while and walk a mile in another man's shoes before you speak about things.
Either that, or start bitching about where your tax dollars are going other than to provide food for people who need it.
Do Right, Be Right. :)
If a person has no income and chooses to pile on expenses like housing and cable, how is that your fault or mine?
Do you really feel more than 3 Million American Citizens fall into that boat?
You must have not read any of my posts here since 2007. For Tea Party Patriots like myself, few topics are bitched about more than wasteful Government Spending, Federal Debt, Waste, Fraud, Abuse, and I am certain I have posted about it here.
NOTIFY: Y | REPLY | REPLY WITH QUOTE | PERMALINK | TOP | HOME
Quote:
Originally posted by JEWELSTAITEFAN:Quote:I said breadwinners. Such as Head of Families.
Originally posted by 6IXSTRINGJACK:Quote:I wouldn't know. There's a lot of adults working jobs that children used to work these days. Many of them pay national minimum wage or very close to it. Most of them aren't full time and provide zero benefits. I've worked enough shitty jobs to know this.
Originally posted by JEWELSTAITEFAN:
I don't think I said there was no need.
$10-12k per year. That would be about $5-6 per hour for 40 hours per week, with no overtime or tips. Or about $10-12 per hour for 20 hours per week.
Of those who are the breadwinners in a family, how many in America do you think have income of $10-12k per year?
I think maybe you need to slum it for a while and walk a mile in another man's shoes before you speak about things.
Either that, or start bitching about where your tax dollars are going other than to provide food for people who need it.
Do Right, Be Right. :)
What is a breadwinner these days? That term doesn't hold any meaning if you've got two parents working part time, near minimum wage jobs, or a single parent trying to balance 2 or 3 of them. Quite a few of the people I've worked with manage to eek out more than 40 hours a week at almost worthless pay by having more than one job. That in itself is a stress I'm grateful not to have myself. No employer wants to work around another employer's schedule.
Quote:
If a person has no income and chooses to pile on expenses like housing and cable, how is that your fault or mine?
I agree about the cable, and also high priced cell plans, and a lot of other bad financial choices. But what about housing? What do you mean by that? Should people working these jobs and their children be homeless? Apartment rent isn't cheap either, and in many cases even in 2018 a monthly mortgage is less than rent.
I'll let you throw out an average justifiable monthly cost of housing. Multiply that by 12 and subtract it from these part time wages for a year, and then imagine how far the rest of that money goes.
Quote:
Do you really feel more than 3 Million American Citizens fall into that boat?
That would be less than 1%. If you include children, which you should because we're talking about how many people can or can't afford to eat without subsidies, then yes I absolutely do.
Quote:
You must have not read any of my posts here since 2007. For Tea Party Patriots like myself, few topics are bitched about more than wasteful Government Spending, Federal Debt, Waste, Fraud, Abuse, and I am certain I have posted about it here.
I don't label myself Tea Party or anything else, but I'd probably agree with you on 90% or more of other topics surrounding wasteful spending. Food, for many reasons, just isn't one of them.
I'm not going to deny that there are cases where this system is abused. Unfortunately, once in the program a lot of the stuff is automated without a ton of oversight. It's kind of a necessity that it is though because it's expensive to do intense moderating of these programs and at some point you'd be spending more on the oversight than you would on providing the benefits themselves.
As I originally stated, at the very least it takes away any need for anyone to be burglarizing houses or pulling a weapon on you out in the street for your wallet because they (or thier kids) haven't eaten in 3 days.
Even at 65 billion dollars a year, that doesn't seem like that high a price to pay when you compare it to other massive wastes of taxpayer dollars out there that in no way benefit anybody.
Do Right, Be Right. :)
NOTIFY: Y | REPLY | REPLY WITH QUOTE | PERMALINK | TOP | HOME
ADDENDUM:
Now... since we're on the topic I feel that I should state that the limit to what you can buy with the food stamp program should be much more tightly regulated, and I'm not at all buying any of the bullshit excuses about why they haven't yet done it.
Firstly, you absolutely cannot buy any product that is non-consumable. You also cannot buy cigarettes and booze with the food stamps. This has been set in stone and because of computers you simply cannot find a way around it. There is no instances of employees "cutting somebody a break" and giving them restricted items with the foodstamps.
There is ZERO reason why this shouldn't be applied to many other things that are commonly bought with food stamps. It would not cost much upfront to implement because all it would require is a few database changes that would add more stuff to the restricted items lists. (Most companies base their products by Category, so instead of having to manually restrict hundreds or thousands of items individually and continue to manually do it when a new product comes in, they can simply say that any item that falls under "Category 43" cannot be purchased with food stamps, for example).
Here's a few that I'd restrict, effective immediately, if I had the power to do so:
1. Soda. Any type. Any flavor. Diet or non diet. All carbonated beverages. This especially includes the expensive Monster and Red Bull type "energy" drinks that has god knows what in them.
2. Coffee.
3. Candy of any type.
4. Cookies, cupcakes, cake, etc.
5. Chips/Cheetos, etc.
6. Bottled water.
With the exception of the water, none of these things are good for you and none of these things are necessary for sustenance. As with smoking or drinking or any other unhealthy behaviors, the poorest of people are the most likely to indulge in overeating of bad foods.
If we're going to tax the hell out of the privilege of smoking cigarettes, there is no reason we shouldn't be trying to force people who get food from the government to eat healthier (and ultimately lower future health care/disability costs).
As for the water, unless they live in a place like Flynt Michigan, there is no need to be paying for something that is already free.
They can still buy these things themselves of course, but they have to do it with their own earned income. At that point they can ask themselves if cable TV or Hostess Cupcakes are more important to them.
Do Right, Be Right. :)
NOTIFY: Y | REPLY | REPLY WITH QUOTE | PERMALINK | TOP | HOME
Quote:
Originally posted by JEWELSTAITEFAN:
Unquoted for clarity:
Adding to this Table of Data, which seems to best show the components of U6:
Quote:
I will post some actual numbers and let the comparisons and discussion follow. The documented shenanigans of Obamabots deliberately refusing to Report jobless data in the months before the 2012 Election are a different matter, I will just use the Fake Data they produced and pretend it was real.
The BLS uses both Seasonally Adjusted figures and Unadjusted figures, and interchanges them without clearly identifying so. For example, the current Rate of 4.1% (for 4 months straight) is SeasAdj, and the real Rate is 4.5% for Jan 2018. I will use only the Unadjusted numbers, to help maintain clarity and transparency.
Some numbers may have a 0 placed as first digit, to maintain column form in this format.
The 1st column of numbers is the unemployed. The 2nd column is the Rate.
The 3rd column is what is called Marginally Attached to the Labor Force, which is included in the Want A Job Now category but NOT included in the Labor Force category and therefore excluded from the reported Unemployment category. The 5th column is the sum of Unemployed plus Marginally Attached - which more accurately represents the Actual Unemployed. The 6th column is the Rate for column 5 figure.
The 7th column is the Involuntary Part-Time workers, who are Not Employed Full Time due to poor Economy, and want, are able to work FT. The 8th column is the sum of the 5th column plus 7th column. 9th column is the Rate for column 8 figure.
The 10th column is the Civilian Population. 11th column is Labor Force, 12th column is Participation Rate. 13th column is the published U-6 figure.
Figures in thousands.
Mo/Yr Unemp Pcnt MrgAt Pcnt SubTtl Prcnt InvPT Pcnt Total Percnt CivPop LbrForc Prtc% U6%
Jan94 09492 07.3 2120 1.6 11612 09.0 4963 3.8 16575 12.8% 195953 129393 66.0
Jan95 08101 06.2 1783 1.4 09884 07.6 4620 3.5 14504 11.1% 197753 130698 66.1
Jan96 08270 06.3 1737 1.3 10007 07.6 4103 3.1 14110 10.7% 199634 131396 65.8 10.8
Jan97 07933 05.9 1615 1.2 09548 07.1 4338 3.2 13886 10.3% 202285 134317 66.4 10.4
Jan98 07069 05.2 1479 1.1 08548 06.3 4090 3.0 12638 09.3% 204238 135951 66.6 09.3
Jan99 06604 04.8 1358 1.0 07962 05.8 3645 2.6 11607 08.4% 206719 137943 66.7 08.5
Jan00 06316 04.5 1197 0.9 07513 05.4 3355 2.4 10868 07.8% 208782 139621 66.9 07.8
Jan01 06647 04.7 1290 0.9 07937 05.6 3559 2.5 11496 08.2% 210889 141049 66.9 08.1
Jan02 08935 06.3 1509 1.1 10444 07.4 4249 3.0 14693 10.4% 213089 141074 66.2 10.5
Jan02 09051 06.3 1532 1.1 10583 07.4 4453 3.1 15036 10.5% 216506 143228 66.2 10.5
Jan03 09395 06.5 1598 1.1 10993 07.6 5003 3.4 15996 11.0% 219897 145301 66.1 11.0
Jan04 09144 06.3 1670 1.1 10814 07.4 5152 3.5 15966 10.9% 222161 146068 65.7 10.9
Jan05 08444 05.7 1804 1.2 10248 07.0 4793 3.3 15041 10.2% 224837 147125 65.4 10.2
Jan06 07608 05.1 1644 1.1 09252 06.2 4513 3.0 13765 09.2% 227553 149090 65.5 09.2
Jan07 07649 05.0 1577 1.0 09226 06.1 4620 3.0 13846 09.1% 230650 151924 65.9 09.1
Jan08 08221 05.4 1729 1.1 09950 06.5 5235 3.4 15185 09.9% 232616 152828 65.7 09.9
Jan09 13009 08.5 2130 1.4 15139 09.9 8675 5.6 23814 15.5% 234739 153445 65.4 15.4
Jan10 16147 10.6 2539 1.6 18686 12.2 9161 6.0 27847 18.2% 236832 152957 64.6 18.0
Jan11 14937 09.8 2800 1.8 17737 11.6 9027 5.9 26764 17.5% 238704 152536 63.9 17.3
Jan12 13541 08.8 2809 1.9 16350 10.7 8747 5.7 25097 16.4% 242269 153485 63.4 16.2
Jan13 13181 08.5 2443 1.6 15624 10.1 8506 5.5 24130 15.6% 244663 154794 63.3 15.4
Jan14 10855 07.0 2592 1.7 13447 08.7 7617 4.9 21064 13.6% 246915 154381 62.5 13.5
Jan15 09498 06.1 2234 1.4 11732 07.5 7125 4.6 18857 12.1% 249723 156050 62.5 12.0
Jan16 08309 05.3 2089 1.3 10398 06.6 6234 4.0 16632 10.6% 252397 157347 62.3 10.5
Jan17 08149 05.1 1752 1.1 09901 06.2 6127 3.9 16028 10.1% 254082 158676 62.5 10.1
Ja18 07189 04.5 1653 1.0 08842 05.5 5380 3.4 14222 08.9 256780 160037 62.3 08.9
Feb18 07091 04.4 1602
NOTIFY: Y | REPLY | REPLY WITH QUOTE | PERMALINK | TOP | HOME
Quote:I am not convinced that you are delusional enough to actually believe this. Maybe you are fatigued or off your meds. Or do you never read the news?
Originally posted by 6IXSTRINGJACK:
ADDENDUM:
Firstly, you absolutely cannot buy any product that is non-consumable. You also cannot buy cigarettes and booze with the food stamps. This has been set in stone and because of computers you simply cannot find a way around it. There is no instances of employees "cutting somebody a break" and giving them restricted items with the foodstamps.
Quote:I agree with 1, 3, 4, 5. I had thought they were already prohibited. Although Bakery products might be in the category of bread, which is a necessary staple.
There is ZERO reason why this shouldn't be applied to many other things that are commonly bought with food stamps. It would not cost much upfront to implement because all it would require is a few database changes that would add more stuff to the restricted items lists. (Most companies base their products by Category, so instead of having to manually restrict hundreds or thousands of items individually and continue to manually do it when a new product comes in, they can simply say that any item that falls under "Category 43" cannot be purchased with food stamps, for example).
Here's a few that I'd restrict, effective immediately, if I had the power to do so:
1. Soda. Any type. Any flavor. Diet or non diet. All carbonated beverages. This especially includes the expensive Monster and Red Bull type "energy" drinks that has god knows what in them.
2. Coffee.
3. Candy of any type.
4. Cookies, cupcakes, cake, etc.
5. Chips/Cheetos, etc.
6. Bottled water.
With the exception of the water, none of these things are good for you and none of these things are necessary for sustenance. As with smoking or drinking or any other unhealthy behaviors, the poorest of people are the most likely to indulge in overeating of bad foods.
If we're going to tax the hell out of the privilege of smoking cigarettes, there is no reason we shouldn't be trying to force people who get food from the government to eat healthier (and ultimately lower future health care/disability costs).
As for the water, unless they live in a place like Flynt Michigan, there is no need to be paying for something that is already free.
They can still buy these things themselves of course, but they have to do it with their own earned income. At that point they can ask themselves if cable TV or Hostess Cupcakes are more important to them.
Do Right, Be Right. :)
Aren't these items controlled by each individual State?
I do not consume coffee, except as a flavor such as Mocha. But in an endeavor to support the goals of work, employment, productivity, I might consider it depravation to withhold a caffeine source, after already deleting soda. Certainly no need for Starbucks or Keurig, but the cheapest economy size of non-gourmet coffee seems reasonable.
Your stereotyping of poor people as being different from others merely because of the greater availability of tobacco and alcohol compared to your favorites of pot and coke is cringeworthy. You seem to mistake indulgence with cheap and readily available.
Have you any idea how many communities procure substandard water quality to their residents? Quality so bad they are required to disclose to the public, albeit in obfuscated media and methods.
And guess which neighborhoods the worst water is supplied to - not the wealthiest!
If I had the authority, my opinion would include prohibition of anything with High Fructose Corn Syrup or Sucralose. Other possibilities include Industrial byproduct Vanillin, carcinogen Saccharine, and paralytic Aspartame.
NOTIFY: Y | REPLY | REPLY WITH QUOTE | PERMALINK | TOP | HOME
Quote:I don't label myself Tea Party or anything else, but I'd probably agree with you on 90% or more of other topics surrounding wasteful spending. Food, for many reasons, just isn't one of them.
Originally posted by 6IXSTRINGJACK:Quote:What is a breadwinner these days? That term doesn't hold any meaning if you've got two parents working part time, near minimum wage jobs, or a single parent trying to balance 2 or 3 of them.
Originally posted by JEWELSTAITEFAN:Quote:I said breadwinners. Such as Head of Families.
Originally posted by 6IXSTRINGJACK:Quote:I wouldn't know. There's a lot of adults working jobs that children used to work these days. Many of them pay national minimum wage or very close to it. Most of them aren't full time and provide zero benefits. I've worked enough shitty jobs to know this.
Originally posted by JEWELSTAITEFAN:
I don't think I said there was no need.
$10-12k per year. That would be about $5-6 per hour for 40 hours per week, with no overtime or tips. Or about $10-12 per hour for 20 hours per week.
Of those who are the breadwinners in a family, how many in America do you think have income of $10-12k per year?
I think maybe you need to slum it for a while and walk a mile in another man's shoes before you speak about things.
Either that, or start bitching about where your tax dollars are going other than to provide food for people who need it.
Do Right, Be Right. :)Quote:I agree about the cable, and also high priced cell plans, and a lot of other bad financial choices. But what about housing? What do you mean by that? Should people working these jobs and their children be homeless? Apartment rent isn't cheap either, and in many cases even in 2018 a monthly mortgage is less than rent.
If a person has no income and chooses to pile on expenses like housing and cable, how is that your fault or mine?
I'll let you throw out an average justifiable monthly cost of housing. Multiply that by 12 and subtract it from these part time wages for a year, and then imagine how far the rest of that money goes.Quote:That would be less than 1%. If you include children, which you should because we're talking about how many people can or can't afford to eat without subsidies, then yes I absolutely do.
Do you really feel more than 3 Million American Citizens fall into that boat?Quote:
You must have not read any of my posts here since 2007. For Tea Party Patriots like myself, few topics are bitched about more than wasteful Government Spending, Federal Debt, Waste, Fraud, Abuse, and I am certain I have posted about it here.
I'm not going to deny that there are cases where this system is abused. Unfortunately, once in the program a lot of the stuff is automated without a ton of oversight. It's kind of a necessity that it is though because it's expensive to do intense moderating of these programs and at some point you'd be spending more on the oversight than you would on providing the benefits themselves.
As I originally stated, at the very least it takes away any need for anyone to be burglarizing houses or pulling a weapon on you out in the street for your wallet because they (or thier kids) haven't eaten in 3 days.
Even at 65 billion dollars a year, that doesn't seem like that high a price to pay when you compare it to other massive wastes of taxpayer dollars out there that in no way benefit anybody.
Do Right, Be Right. :)
Breadwinner supplies funds for the family unit. Stay at home mom or dad is not breadwinner.
Many refuse to accept living with their parents or other family, instead insisting upon paying for housing which they know for certain they cannot afford.
The Food Stamp program estimates the validly needy population at 1%, so you are in disagreement with the Food Stamp authority. You are steadfastly refusing to identify any level of Participation that is reasonable. Food St
NOTIFY: Y | REPLY | REPLY WITH QUOTE | PERMALINK | TOP | HOME
Adding to this Table of Data, which includes Not Fully Employed Rate.
I will refer to this set of data as Table JSF-URF-3
I will post some actual numbers and let the comparisons and discussion follow.
The BLS uses both Seasonally Adjusted figures and Unadjusted figures, and interchanges them without clearly identifying so. I will use only the Unadjusted numbers, to help maintain clarity and transparency.
Some numbers may have a 0 placed as first digit, to maintain column form in this format.
The 1st column of numbers is the Unemployed.
The 2nd column is what is called Marginally Attached to the Labor Force, which is included in the Want A Job Now category but NOT included in the Labor Force category and therefore excluded from the reported Unemployment category.
The 3rd column is the Involuntary Part-Time workers, who are Not Employed Full Time due to poor Economy, and want, are able to work FT. The 4th column of numbers is the sum of the 1st, 2nd, and 3rd columns. 5th column is the Rate for column 4 figure, divided by Labor Force.
The 6th column of numbers is the Subtotal of columns 1 and 3, Unemployed plus Involuntary Part-Time.
The 7th column is Labor Force minus column 6. This is also Employed minus column 3 Involuntary Part-Time. This is not a figure identified by BLS, so I will call it Actually Fully Employed. This is Employed Full-time plus Voluntary Part-Time.
Not listed, but Civilian noninstitutional Population minus Actually Fully Employed is also a figure avoided by BLS, and I will call it Not Fully Employed, which is Unemployed plus Involuntary Part-Time plus Marginally Attached plus Not In Labor Force. The 8th column is Not Fully Employed Rate, which is divided by Civilian noninstitutional Population.
The 9th column is the Civilian Population. 10th column is Labor Force, 11th column is Participation Rate. 12th column is the published U-6 figure.
Figures in thousands.
Mo/Yr Unem MrgAt InvPT Total Prcnt SubTtl AcEmpl NtEm CivPop LbrForc Prtc% U6%
Jan94 09492 2120 4963 16575 12.8% 14455 114938 41.3% 195953 129393 66.0
Jan95 08101 1783 4620 14504 11.1% 12721 117923 40.4% 197753 130698 66.1
Jan96 08270 1737 4103 14110 10.7% 12373 119023 40.4% 199634 131396 65.8 10.8
Jan97 07933 1615 4338 13886 10.3% 12271 122046 39.7% 202285 134317 66.4 10.4
Jan98 07069 1479 4090 12638 09.3% 11159 124798 38.9% 204238 135951 66.6 09.3
Jan99 06604 1358 3645 11607 08.4% 10249 127694 38.2% 206719 137943 66.7 08.5
Jan00 06316 1197 3355 10868 07.8% 09671 129950 37.8% 208782 139621 66.9 07.8
Jan01 06647 1290 3559 11496 08.2% 10206 130843 38.0% 210889 141049 66.9 08.1
Jan02 08935 1509 4249 14693 10.4% 13184 127890 40.0% 213089 141074 66.2 10.5
Jan02 09051 1532 4453 15036 10.5% 13504 129724 40.1% 216506 143228 66.2 10.5
Jan03 09395 1598 5003 15996 11.0% 14398 130903 40.5% 219897 145301 66.1 11.0
Jan04 09144 1670 5152 15966 10.9% 14296 131772 40.7% 222161 146068 65.7 10.9
Jan05 08444 1804 4793 15041 10.2% 13237 133888 40.5% 224837 147125 65.4 10.2
Jan06 07608 1644 4513 13765 09.2% 12122 136978 39.8% 227553 149090 65.5 09.2
Jan07 07649 1577 4620 13846 09.1% 12269 139655 39.5% 230650 151924 65.9 09.1
Jan08 08221 1729 5235 15185 09.9% 13456 139372 40.1% 232616 152828 65.7 09.9
Jan09 13009 2130 8675 23814 15.5% 21684 131761 43.9% 234739 153445 65.4 15.4
Jan10 16147 2539 9161 27847 18.2% 25308 127649 46.1% 236832 152957 64.6 18.0
Jan11 14937 2800 9027 26764 17.5% 23964 128572 46.1% 238704 152536 63.9 17.3
Jan12 13541 2809 8747 25097 16.4% 22288 131197 45.8% 242269 153485 63.4 16.2
Jan13 13181 2443 8506 24130 15.6% 21687 133107 45.6% 244663 154794 63.3 15.4
Jan14 10855 2592 7617 21064 13.6% 18472 135909 45.0% 246915 154381 62.5 13.5
Jan15 09498 2234 7125 18857 12.1% 16623 139427 44.2% 249723 156050 62.5 12.0
Jan16 08309 2089 6234 16632 10.6% 14543 142804 43.4% 252397 157347 62.3 10.5
Jan17 08149 1752 6127 16028 10.1% 14276 144400 43.2% 254082 158676 62.5 10.1
Jan18 07189 1653 5380 14222 08.9% 12569 147468 42.6% 256780 160037 62.3 08.9
F
NOTIFY: Y | REPLY | REPLY WITH QUOTE | PERMALINK | TOP | HOME
NOTIFY: Y | REPLY | REPLY WITH QUOTE | PERMALINK | TOP | HOME
Quote:I have wondered why anybody would believe any of this.
Originally posted by JEWELSTAITEFAN:Quote:Holy Cow, you must be a genius!!!
Originally posted by 6IXSTRINGJACK:Quote:Not fake news.
Originally posted by JEWELSTAITEFAN:
1. Explain the Fake News Story that the Stock Market Crashed in March 2000.
The Dotcom Crash - March 11, 2000 to October 9, 2002
The Nasdaq Composite lost 78% of its value as it fell from 5046.86 to 1114.11.
https://www.investopedia.com/features/crashes/crashes8.asp
Do Right, Be Right. :)
A specialized subpart of a corner of The Stock Market has a decline over 30 months so IT MUST BE A CRASH!!!
From Jan 2000 at 11,700 Dow until May 2001 with a couple hundred less Dow, that is just crystal clarity in focusing your laser sharp identification of massive drops in STOCK MARKET VALUE. Dropping a whole couple percent in only a span of 16 months, that is such a total CRASH, totally fer sure.
By this standard of measurement, the huge CRASH from July 1997 to October 2002 resulted in the drop from 8,038 down to a whopping 7,286 in only a period of 63 months, a loss of almost 10%, or almost 1% per 9 months.
I'm really disappointed you believe such pablum.
A decrease from May 2001 to October 2002 of 4,100 DOW? That's a drop of 36% in 17 months, or over 2% per month average of the Broader Market, so probably doesn't suit your definition of a Crash.
In MArch 2000 it looks like Dow was under 10,000. So then it gained about 1,600 by May 2001. With a gain of about 16% from the onset of your defined CRASH, that much gain indicates such a horrible crash, everybody must have known about it!! But the News of the time did not report this 16% growth as a crash.
Perhaps a perspective refresher can help casual readers focus.
NASDAQ was a fledgling index 16 years ago, and largely inconsequential.
It started in 1971 under ticker symbol NASD. Remember how impressive Google was back then? Apple? Netflix? Amazon? Napster? Microsoft? Yahoo? BetaMax, VHS, or CDs (Phillips)? Juno? AOL? Norton? PKZip? Atari, Nintendo? Dell? This was at least 15 years before algore invented the Internet.
During 2000 and 2001 the newly hatched NDAQ had a series of selloffs, divesting NASD from NDAQ. While being propped up by these collapsible stilts of new unstable fickle tech stocks, some people imagine that such a major transfer of core funds of this volatile index as being indicative of some persistent loss of value and crash.
Anybody want to guess where Amazon was in 2000? Which color iFruit were tech-savvy buyers choosing? Netflix? Facebook? Tweeter? SnapChamp? Instagrinder? Wikipedia?
Some people have so little understanding that they think Microsoft is a tech company instead of a social engineering outfit.
NOTIFY: Y | REPLY | REPLY WITH QUOTE | PERMALINK | TOP | HOME
Adding to this Table of Data, where I included the Margin of Gain for Labor Force, and Margin of Gain for Actually Fully Employed:
I will refer to this set of data as Table JSF-URF-4
I will post some actual numbers and let the comparisons and discussion follow.
The BLS uses both Seasonally Adjusted figures and Unadjusted figures, and interchanges them without clearly identifying so. I will use only the Unadjusted numbers, to help maintain clarity and transparency.
Some numbers may have a 0 placed as first digit, to maintain column form in this format.
The 1st column of numbers is the unemployed.
The 2nd column is what is called Marginally Attached to the Labor Force, which is included in the Want A Job Now category but NOT included in the Labor Force category and therefore excluded from the reported Unemployment category.
The 3rd column is the Involuntary Part-Time workers, who are Not Employed Full Time due to poor Economy, and want, are able to work FT.
The 4th column is the sum of the first 3 columns. 5th column is the Rate for column 4 figure, with Labor Force as the denominator.
The 6th column of numbers is the Subtotal of columns 1 and 3, Unemployed plus Involuntary Part-Time.
The 7th column is Labor Force minus column 6. This is also Employed minus column 3 Involuntary Part-Time. This is not a figure identified by BLS, so I will call it Actually Fully Employed. This is Employed Full-time plus Voluntary Part-Time.
Not listed, but Civilian noninstitutional Population minus Actually Fully Employed is also a figure avoided by BLS, and I will call it Not Fully Employed, which is Unemployed plus Involuntary Part-Time plus Marginally Attached plus Not In Labor Force. The 8th column is Not Fully Employed Rate, which is divided by Civilian noninstitutional Population.
The 9th column is the Civilian Population. 10th column is Labor Force, 11th column is Participation Rate.
The 12th column is Marginal Labor Force Rate. This is the gain of the Labor Force divided by the gain of the Civilian noninstitutional Population.
The 13th column is the Marginal Actual Fully Employed Rate. This is the gain in the Actual Fully Employed divided by the gain of the Civilian noninstitutional Population.
Figures in thousands.
MoYr Unem MrgAt InvPT Total Prct SubTtl AcEmpl NtEm CivPop LbrForc Prtc% MgLF MgAE
Ja94 09492 2120 4963 16575 12.8 14455 114938 41.3% 195953 129393 66.0
Ja95 08101 1783 4620 14504 11.1 12721 117923 40.4% 197753 130698 66.1 +072.5 +165.8
Ja96 08270 1737 4103 14110 10.7 12373 119023 40.4% 199634 131396 65.8 +037.1 +058.5
Ja97 07933 1615 4338 13886 10.3 12271 122046 39.7% 202285 134317 66.4 +110.2 +114.1
Ja98 07069 1479 4090 12638 09.3 11159 124798 38.9% 204238 135951 66.6 +083.7 +140.9
Ja99 06604 1358 3645 11607 08.4 10249 127694 38.2% 206719 137943 66.7 +080.3 +116.7
Ja00 06316 1197 3355 10868 07.8 09671 129950 37.8% 208782 139621 66.9 +081.3 +109.4
Ja01 06647 1290 3559 11496 08.2 10206 130843 38.0% 210889 141049 66.9 +067.8 +042.4
Ja02 08935 1509 4249 14693 10.4 13184 127890 40.0% 213089 141074 66.2 +001.1 --134.2
Ja02 09051 1532 4453 15036 10.5 13504 129724 40.1% 216506 143228 66.2 +038.8 --019.9
Ja03 09395 1598 5003 15996 11.0 14398 130903 40.5% 219897 145301 66.1 +061.1 +034.8
Ja04 09144 1670 5152 15966 10.9 14296 131772 40.7% 222161 146068 65.7 +033.9 +038.4
Ja05 08444 1804 4793 15041 10.2 13237 133888 40.5% 224837 147125 65.4 +039.5 +079.1
Ja06 07608 1644 4513 13765 09.2 12122 136978 39.8% 227553 149090 65.5 +072.3 +113.8
Ja07 07649 1577 4620 13846 09.1 12269 139655 39.5% 230650 151924 65.9 +091.5 +086.4
Ja08 08221 1729 5235 15185 09.9 13456 139372 40.1% 232616 152828 65.7 +046.0 --014.4
Ja09 13009 2130 8675 23814 15.5 21684 131761 43.9% 234739 153445 65.4 +029.1 --358.5
Ja10 16147 2539 9161 27847 18.2 25308 127649 46.1% 236832 152957 64.6 --023.3 --196.5
Ja11 14937 2800 9027 26764 17.5 23964 128572 46
NOTIFY: Y | REPLY | REPLY WITH QUOTE | PERMALINK | TOP | HOME
Quote:I've tried several different edits. No 2 versions display the same on any 2 different computers. There is a way, but it is far too inelegant for me to work on at this point, maybe sometime later. Most of the number columns are able to line up, but the headers are impossible to predict. I think I've reduced a lot of wordwrapping.
Originally posted by JEWELSTAITEFAN:Quote:Well, now that I've compiled the data from disparate source locations, it should be relatively easy to transfer to your preferred format template. Select the "reply with quote" function, select and move the text to a word processing document to work with it, delete the font commands that I added in, then most format templates will allow a merge of columns and rows into the format.
Originally posted by 6IXSTRINGJACK:Quote:I can see now why you were reluctant to go the extra mile. I had no idea that you were compiling data from that site.
Originally posted by JEWELSTAITEFAN:
The data in my Tables regarding Unemployment Rates are compiled from the BLS Reports.
Here is a link to the Reports, you may dig for and confirm/verify any data you choose:
https://www.bls.gov/bls/news-release/home.htm
Why do I get the feeling that this stuff is intentionally obfuscated?
There is nothing at all intuitive about that website. I applaud your efforts to try to put the data together. We'll have to figure out a way to make it intelligible outside of this forum.
Do Right, Be Right. :)
You could even command Courier New font, reduce Font Size to your liking (or use Landscape Orientation), and convert to PDF.
NOTIFY: Y | REPLY | REPLY WITH QUOTE | PERMALINK | TOP | HOME